PharaohPanCoin
No content yet
PharaohPanCoin
BTC has once again broken its historical high. Recently, it was mentioned that the daily chart reached a critical point and broke above it, thus achieving a new historical high. I've been reminding my frens in the circle that the bull run will not easily come to an end. This trend is clearly very similar to the previous one. The peak of this bull run was also predicted back in April, likely not exceeding 128000 USD. Please continue to patiently wait for the opportunity to short BTC in the larger cycle.
BTC0.61%


- Reward
- like
- 1
- Share
Pontoque:
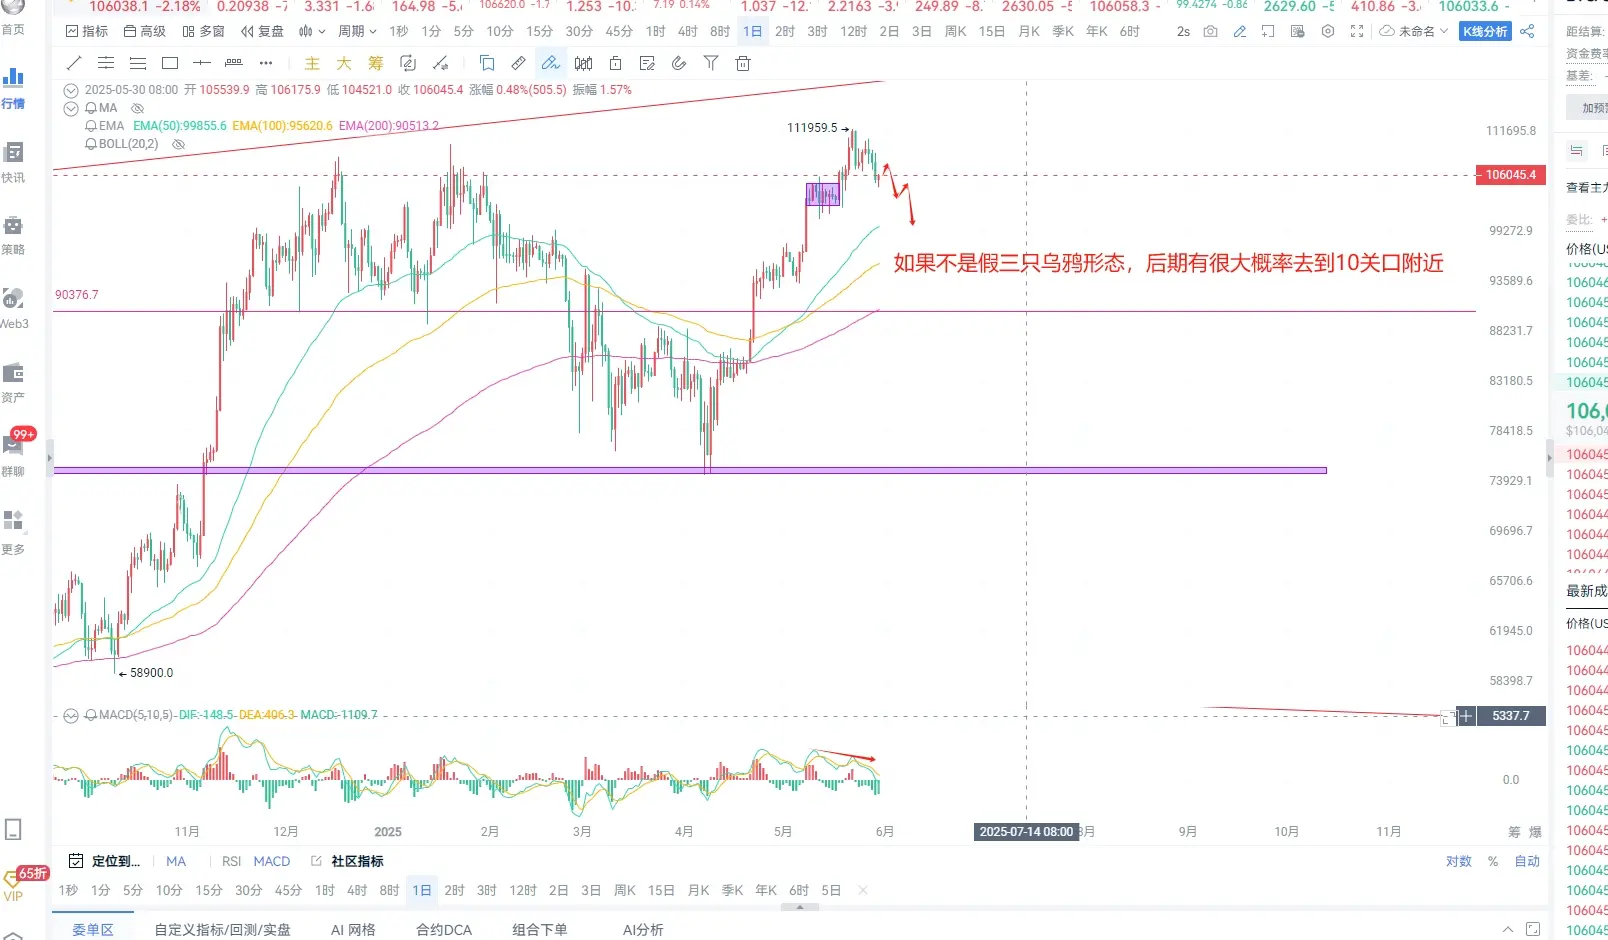
HODL Tight 💪May 30 morning: BTC daily chart forms a three black crows pattern: daily chart top divergence: is the top approaching?
Hello everyone, I'm Lao Wang. Today, I will present an analysis of a future trend in article format. Those who watched my video article yesterday should have gained some good insights. In the video, I also reminded everyone to be cautious of the daily chart three black crows pattern. Let's first talk about the weekly K pattern. After breaking the historical high, the weekly K has shown some signs of exhaustion. This situation indicates that continuous efforts to push upwards n
View OriginalHello everyone, I'm Lao Wang. Today, I will present an analysis of a future trend in article format. Those who watched my video article yesterday should have gained some good insights. In the video, I also reminded everyone to be cautious of the daily chart three black crows pattern. Let's first talk about the weekly K pattern. After breaking the historical high, the weekly K has shown some signs of exhaustion. This situation indicates that continuous efforts to push upwards n
- Reward
- like
- 1
- Share
GateUser-6ebdb7bd:
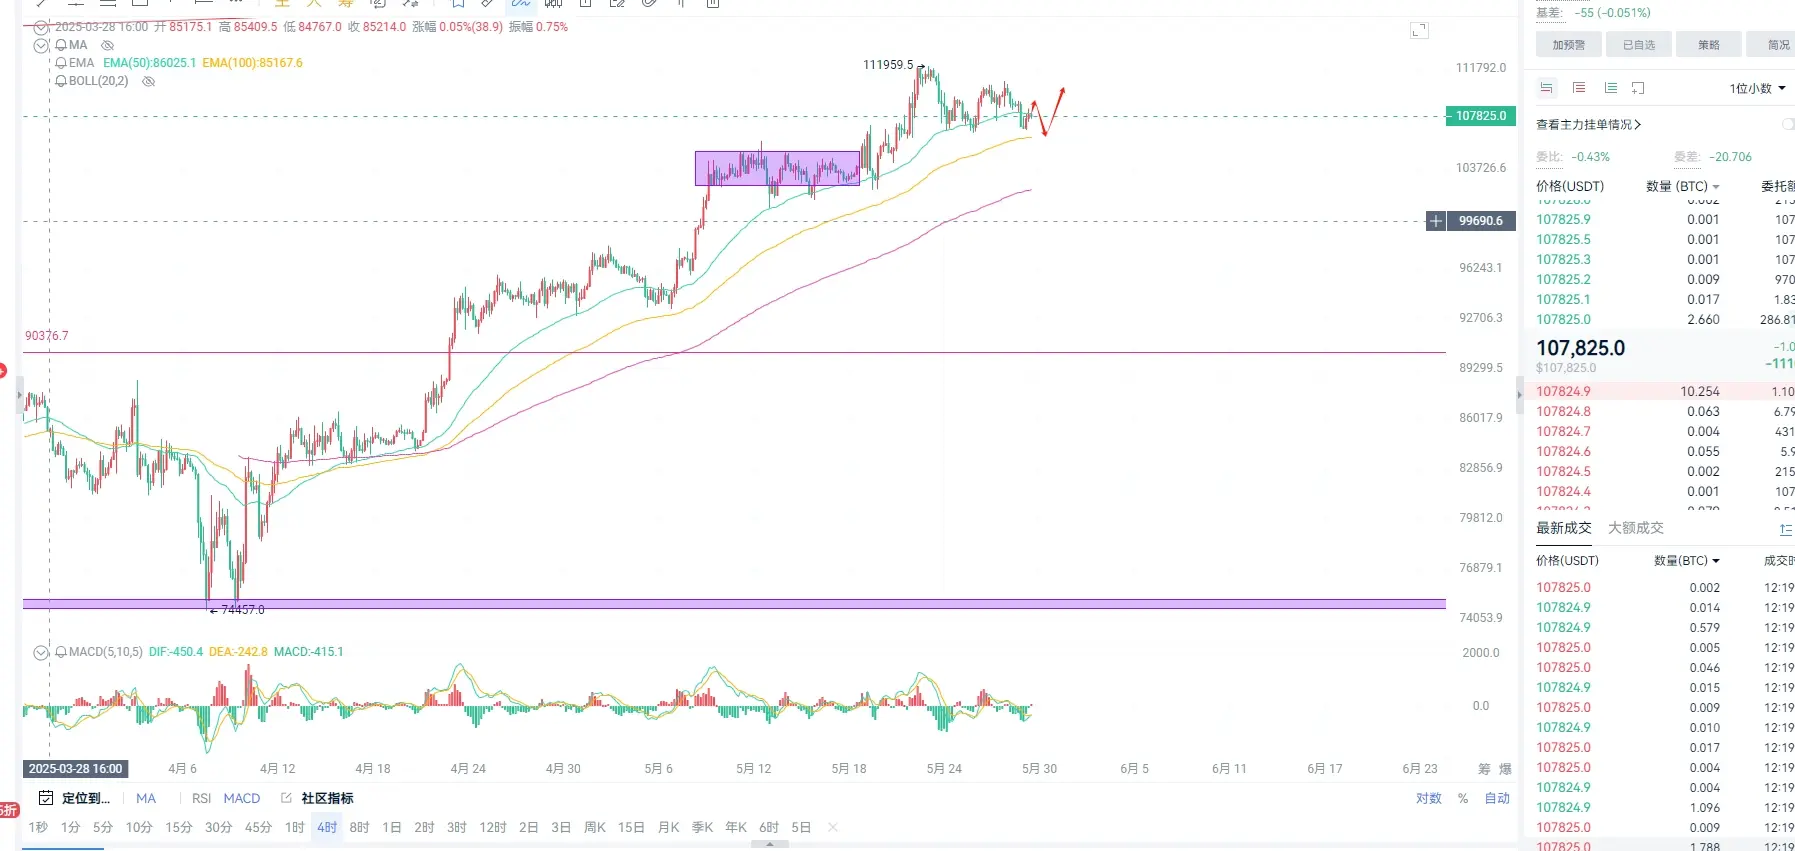
rjukfmfjzd d. dhwxsb dMay 29: BTC is about to close the monthly K-line: the weekly K-line long positions still exist: layout requires patient waiting.
I haven't updated articles for my brothers in a long time: A few days ago, I took the time to record a short video for everyone, but I only published it in a few places. In the last video, I reminded everyone not to panic about high-level positions, as the weekly K long positions have not ended. I have been quite busy lately and haven't recorded many videos, written articles, or done live streams. Today, I took some time to share my analysis of the current and future
View OriginalI haven't updated articles for my brothers in a long time: A few days ago, I took the time to record a short video for everyone, but I only published it in a few places. In the last video, I reminded everyone not to panic about high-level positions, as the weekly K long positions have not ended. I have been quite busy lately and haven't recorded many videos, written articles, or done live streams. Today, I took some time to share my analysis of the current and future
- Reward
- like
- Comment
- Share
Long time no see, brothers. Don't panic about the high-level trap positions; it's a normal pullback. The weekly K chart's long positions haven't finished yet, and we are still over 10,000 dollars away from the projected point. In the previous videos, I reminded spot trading brothers multiple times that the first Rug Pull point is near the historical high. The last Rug Pull opportunity is at the point projected by Old Wang. Buy when no one is asking, sell when the crowd is excited. I believe the time for opportunity will be when it's time for long-term layout and shorting 📉. Patiently wait for
View Original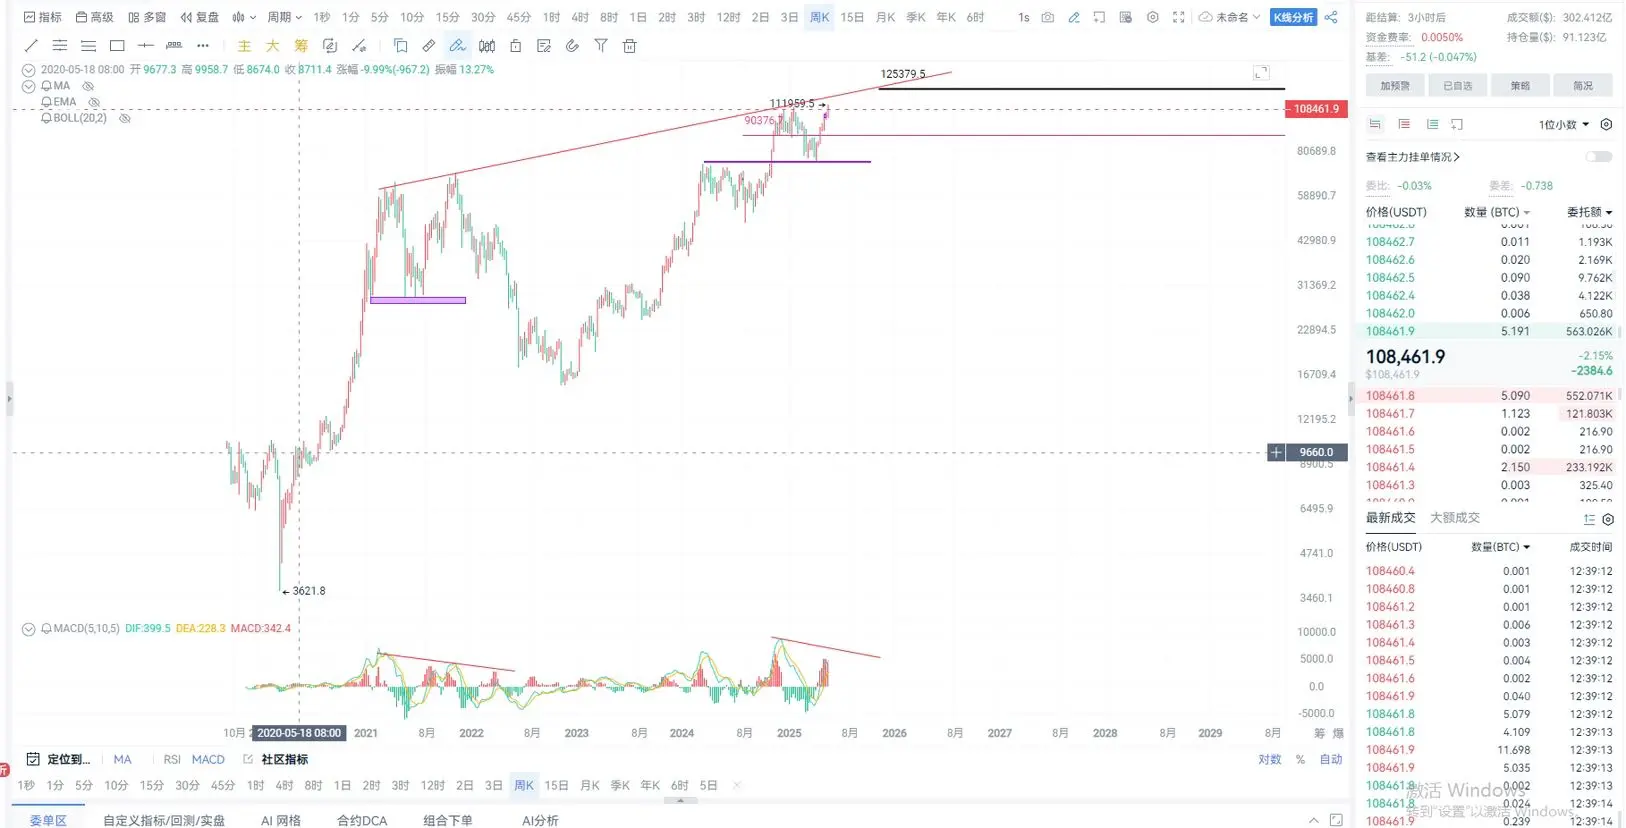
- Reward
- like
- Comment
- Share
April 28: BTC fluctuates around the range: will the support below hold and aim for 98.5K?
BTC weekly K-line closes above the middle band of the Bollinger Bands: as long as it doesn't break the support at the middle band, the later trend will further push towards 98.5K. In yesterday's video, I simulated this for everyone and also set the evening target at 94.5K, aiming south to 92.8K. I reminded everyone in my Moments not to chase north easily. Today, the daily line closes again with a bearish candle: if tomorrow's daily line continues to close bearish, then we need to pay attention to the form
View OriginalBTC weekly K-line closes above the middle band of the Bollinger Bands: as long as it doesn't break the support at the middle band, the later trend will further push towards 98.5K. In yesterday's video, I simulated this for everyone and also set the evening target at 94.5K, aiming south to 92.8K. I reminded everyone in my Moments not to chase north easily. Today, the daily line closes again with a bearish candle: if tomorrow's daily line continues to close bearish, then we need to pay attention to the form
- Reward
- like
- Comment
- Share
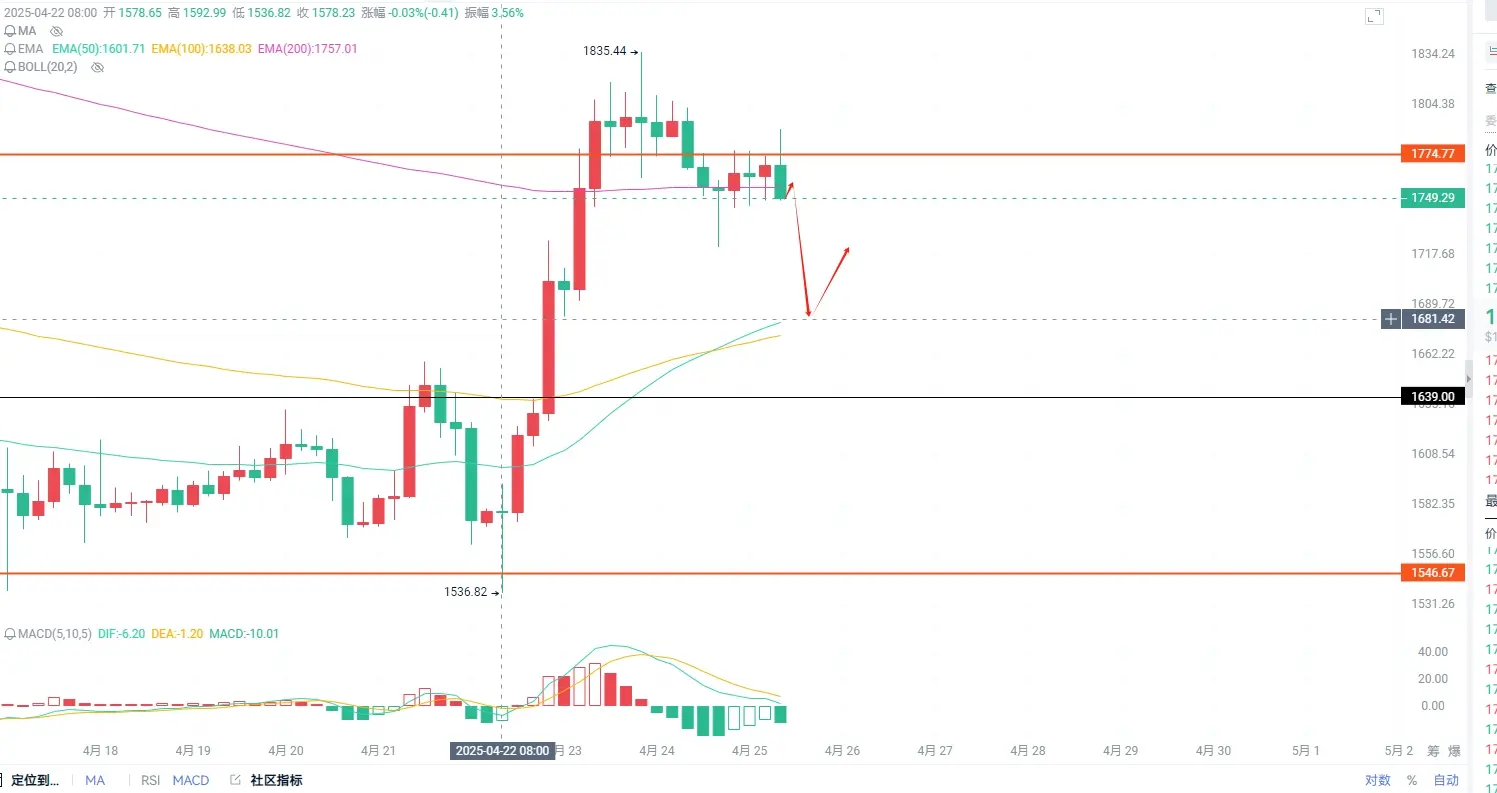
April 25: ETH 1775 has become a key position in the short term above.
ETH is very weak compared to BTC. The Bollinger Bands on the daily chart are gradually narrowing and balancing, with the K-line running at the upper band for three consecutive days, attempting to break through and push the Bollinger Bands to turn upward. Today, the intraday high reached around 1889 but was resisted by the upper band, falling back to around 1750 for a consolidation. On the four-hour chart, pay attention to the naked K resistance level at 1775. If it does not break through and stabilize above this level, it wi
View OriginalETH is very weak compared to BTC. The Bollinger Bands on the daily chart are gradually narrowing and balancing, with the K-line running at the upper band for three consecutive days, attempting to break through and push the Bollinger Bands to turn upward. Today, the intraday high reached around 1889 but was resisted by the upper band, falling back to around 1750 for a consolidation. On the four-hour chart, pay attention to the naked K resistance level at 1775. If it does not break through and stabilize above this level, it wi
- Reward
- like
- Comment
- Share
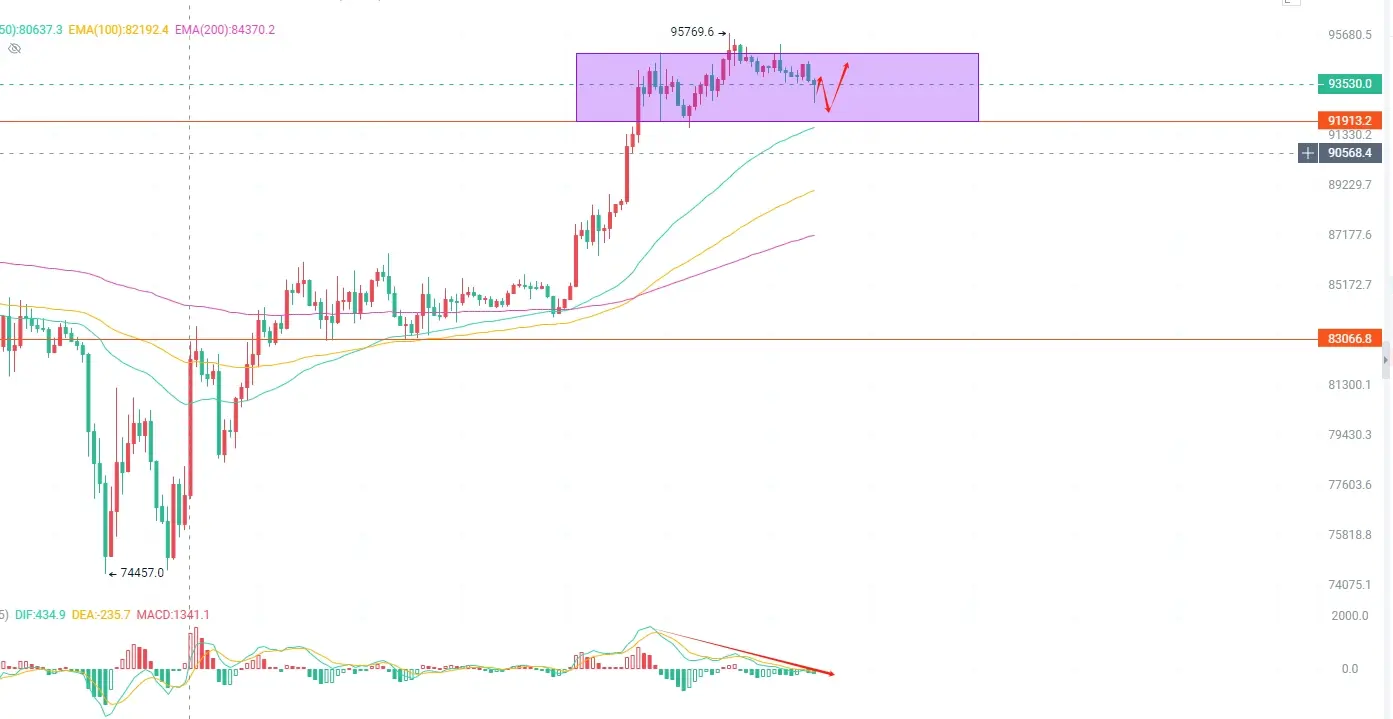
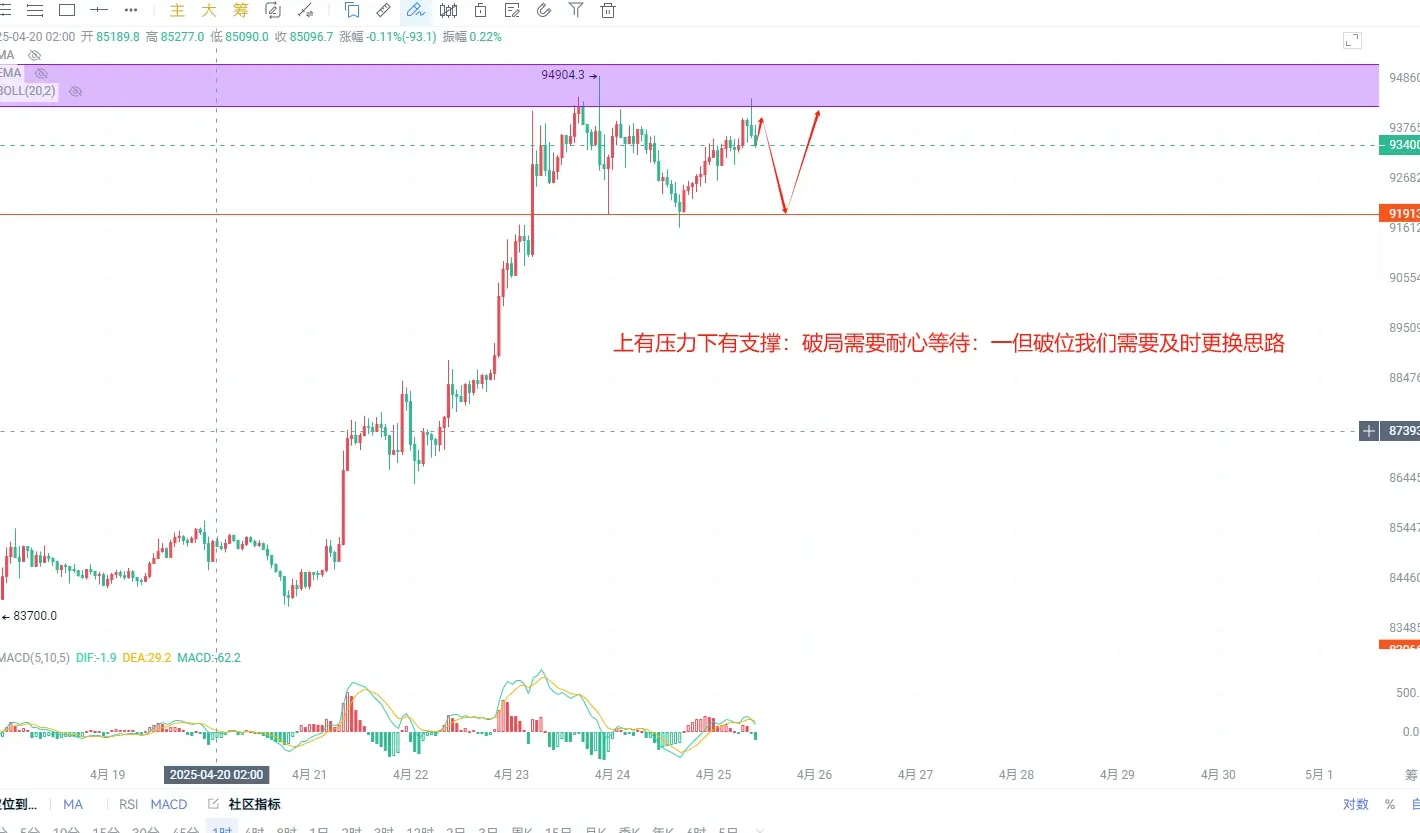
April 25: BTC has reached a critical position on the daily chart: 94.5K will become the watershed?
The daily level of the pie closes a hammer line indicating that the lower support level is stronger, the Bollinger band opening runs upward, and the pie has tried to break through 94500 many times to stand firm, but this is the relatively strong pass of the Southern Army, In the later stage, if you can break through and stand firm, then the pie will be further pushed to around 98.5K, there is no breakthrough and stand firm here is still in a shock adjustment, it is necessary to pay attention to t
View OriginalThe daily level of the pie closes a hammer line indicating that the lower support level is stronger, the Bollinger band opening runs upward, and the pie has tried to break through 94500 many times to stand firm, but this is the relatively strong pass of the Southern Army, In the later stage, if you can break through and stand firm, then the pie will be further pushed to around 98.5K, there is no breakthrough and stand firm here is still in a shock adjustment, it is necessary to pay attention to t
- Reward
- like
- Comment
- Share
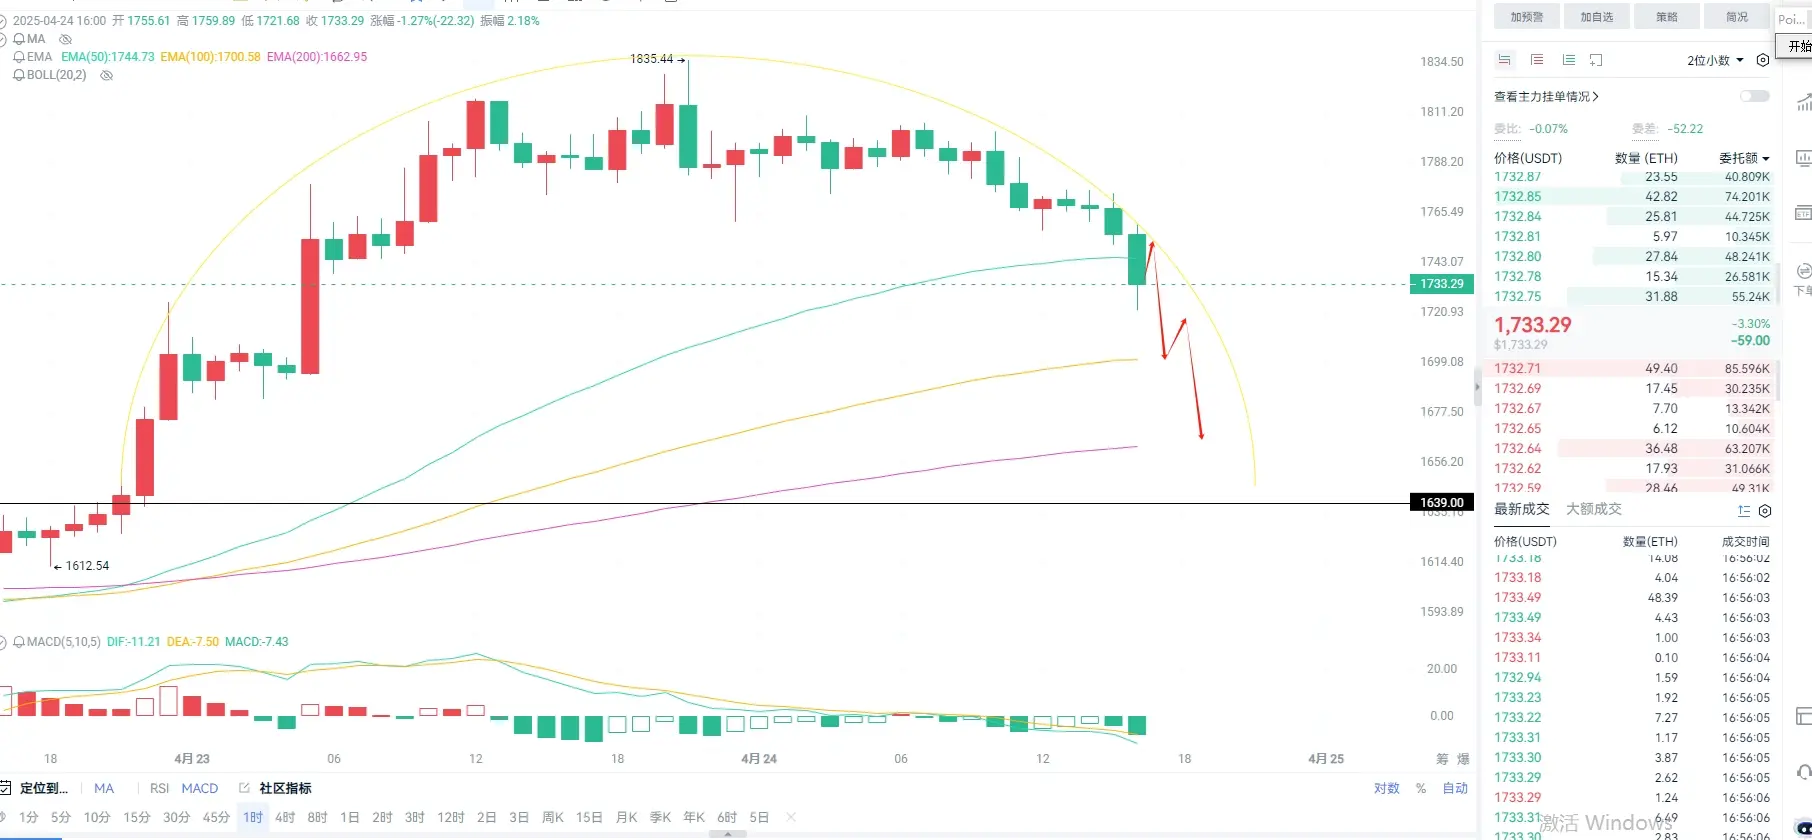
April 24: Is Ether forming an arc top pattern at the hourly level?
Ethereum has broken below the 200-day moving average on the four-hour level, forming a rounded top pattern on the hourly level: currently, the four-hour focus is on the middle Bollinger Band at 1700: if it breaks below this level, Ether will further push down to around 1660. From the four-hour perspective, the market shows some changes, and the bears have signs of strength. Long positions need to pay attention to risk control: just focus on the main support levels: this round of decline is also due to the liquidation of long le
View OriginalEthereum has broken below the 200-day moving average on the four-hour level, forming a rounded top pattern on the hourly level: currently, the four-hour focus is on the middle Bollinger Band at 1700: if it breaks below this level, Ether will further push down to around 1660. From the four-hour perspective, the market shows some changes, and the bears have signs of strength. Long positions need to pay attention to risk control: just focus on the main support levels: this round of decline is also due to the liquidation of long le
- Reward
- like
- Comment
- Share
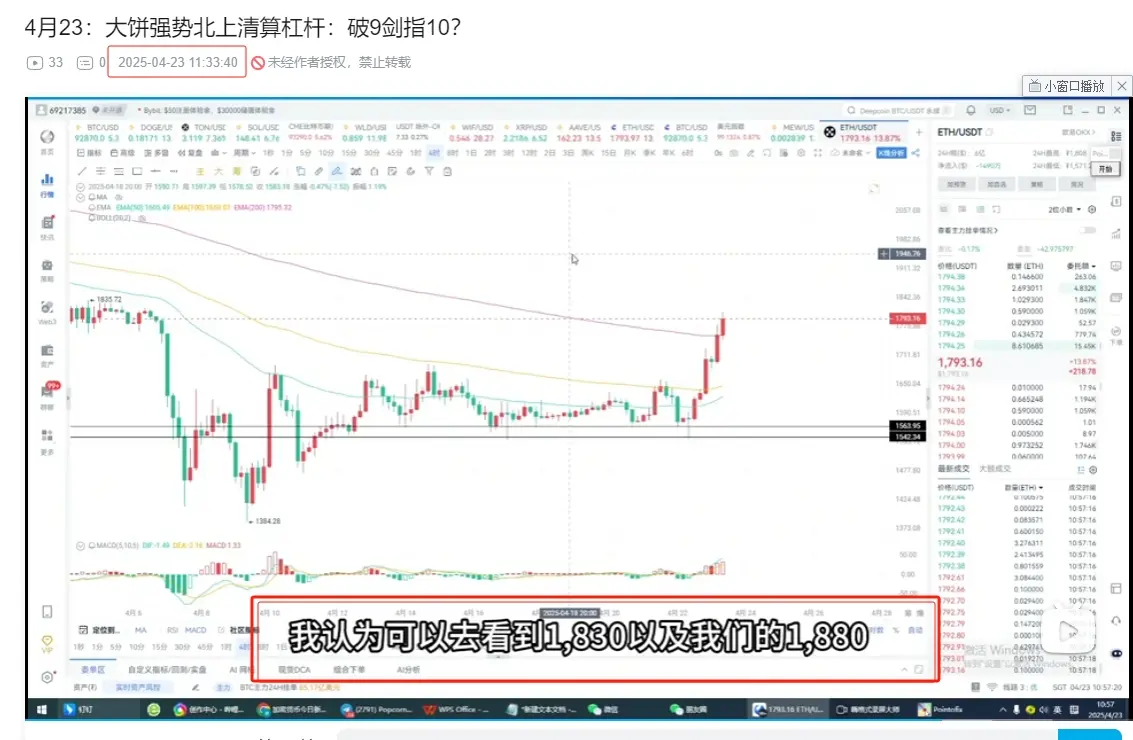
April 24: Will Ethereum's key position continue to consolidate and pullback if it cannot break through?
On the daily chart, Ethereum has consecutively closed with two bullish candles. Ether has also reached the upward target point as expected, which was given in yesterday's video at the range of 1765-1775 for a strong upward view towards 1830-1880. Our internal team members also took positions at this location, including the big coin video which indicated 92100 for the upward movement. Overall, yesterday was quite good. Everyone can watch Lao Wang's videos daily. For Ethereum on the daily char
View OriginalOn the daily chart, Ethereum has consecutively closed with two bullish candles. Ether has also reached the upward target point as expected, which was given in yesterday's video at the range of 1765-1775 for a strong upward view towards 1830-1880. Our internal team members also took positions at this location, including the big coin video which indicated 92100 for the upward movement. Overall, yesterday was quite good. Everyone can watch Lao Wang's videos daily. For Ethereum on the daily char
- Reward
- like
- Comment
- Share
April 24: BTC has been rising north, touching the 95K line: will the temporary adjustment continue to move north?
Daily level forms a doji bullish candle: In the short term, the surface battle between BTC bulls and bears is ongoing, with the southern forces trying to defend the 94.5K level to prevent the northern forces from occupying it. If the northern forces successfully establish a position here, they will likely push up to the 98.5K line. However, if the northern forces cannot effectively break and hold the 94.5K level, this could prevent the southern forces from launching a move that for
View OriginalDaily level forms a doji bullish candle: In the short term, the surface battle between BTC bulls and bears is ongoing, with the southern forces trying to defend the 94.5K level to prevent the northern forces from occupying it. If the northern forces successfully establish a position here, they will likely push up to the 98.5K line. However, if the northern forces cannot effectively break and hold the 94.5K level, this could prevent the southern forces from launching a move that for
- Reward
- like
- Comment
- Share
April 23: BTC breaks through the 90K mark: a critical position is approaching, will it continue to rise or?
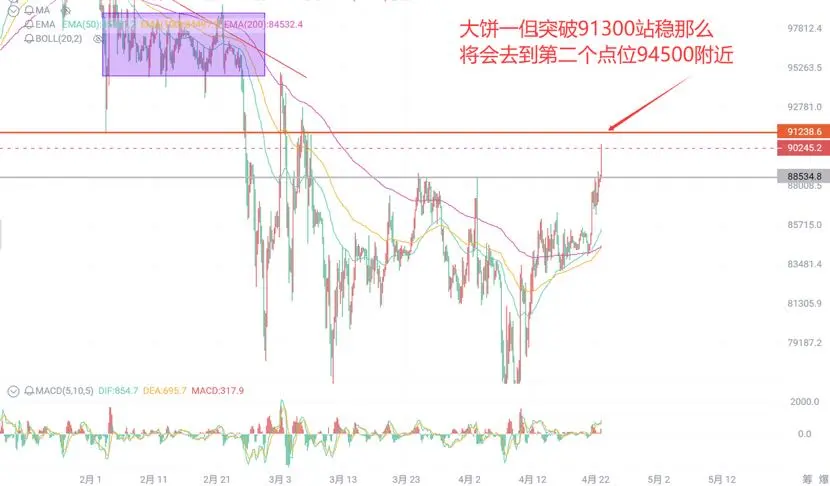
On the daily chart, BTC closed with a bullish candlestick, breaking and stabilizing above 91300. Once a one-sided trend emerges, it won't end that quickly, unless there is a significant pullback during the upward process. This upward trend is akin to boiling a frog in warm water; after rising to a certain level, it starts to consolidate and repair indicators. If the pullback is not strong, then a strong upward movement towards the north is needed. Once it breaks through the next key posi
View OriginalOn the daily chart, BTC closed with a bullish candlestick, breaking and stabilizing above 91300. Once a one-sided trend emerges, it won't end that quickly, unless there is a significant pullback during the upward process. This upward trend is akin to boiling a frog in warm water; after rising to a certain level, it starts to consolidate and repair indicators. If the pullback is not strong, then a strong upward movement towards the north is needed. Once it breaks through the next key posi
- Reward
- like
- Comment
- Share
Those without orders can place a short-term sell order here at 91300. I will also reduce a portion of my long order here, and the stop loss will be moved up to the opening price average. Good luck to everyone, this round 📈. I had made a prediction for his house in a video on Sunday, and next week's weekly K is also quite crucial.
View Original
- Reward
- like
- Comment
- Share
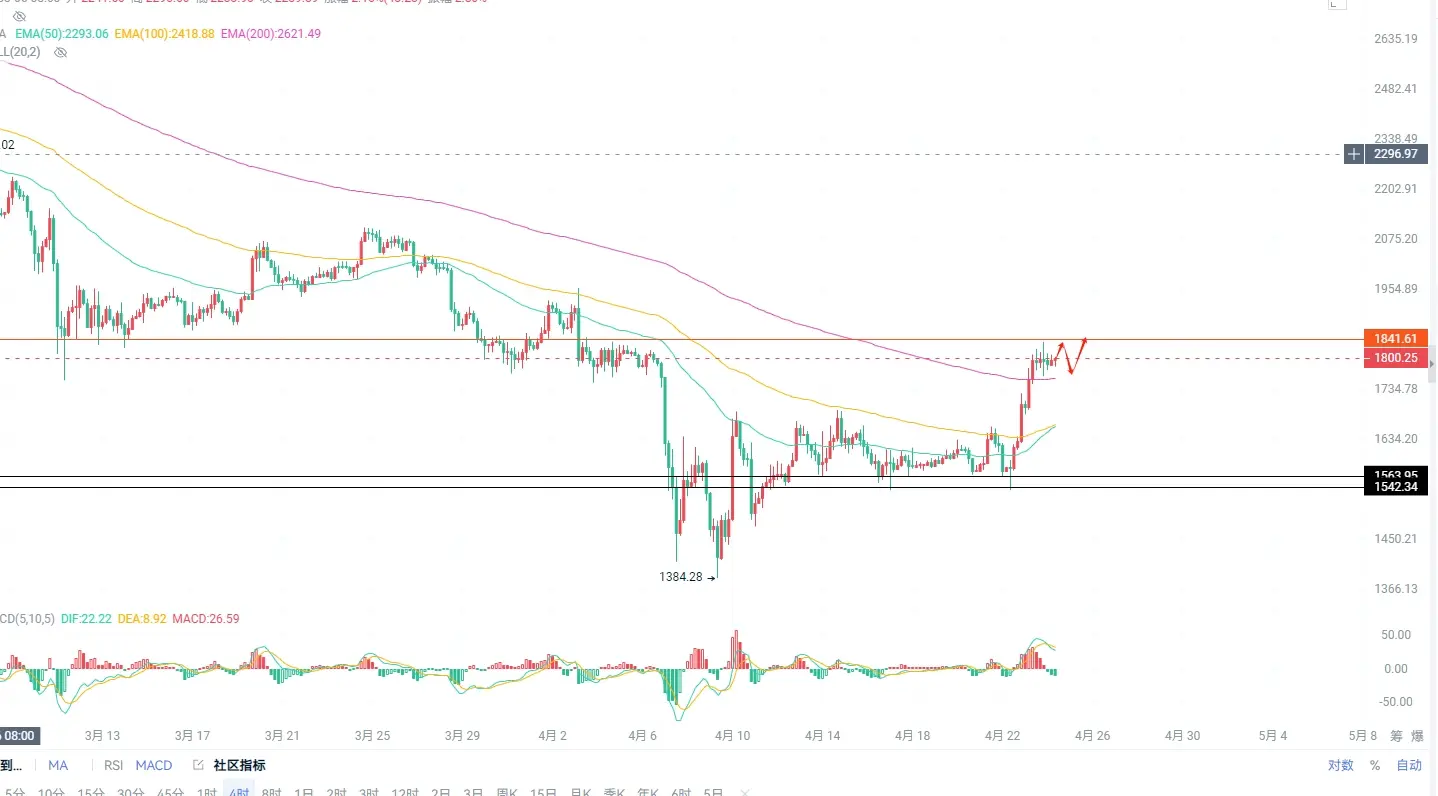
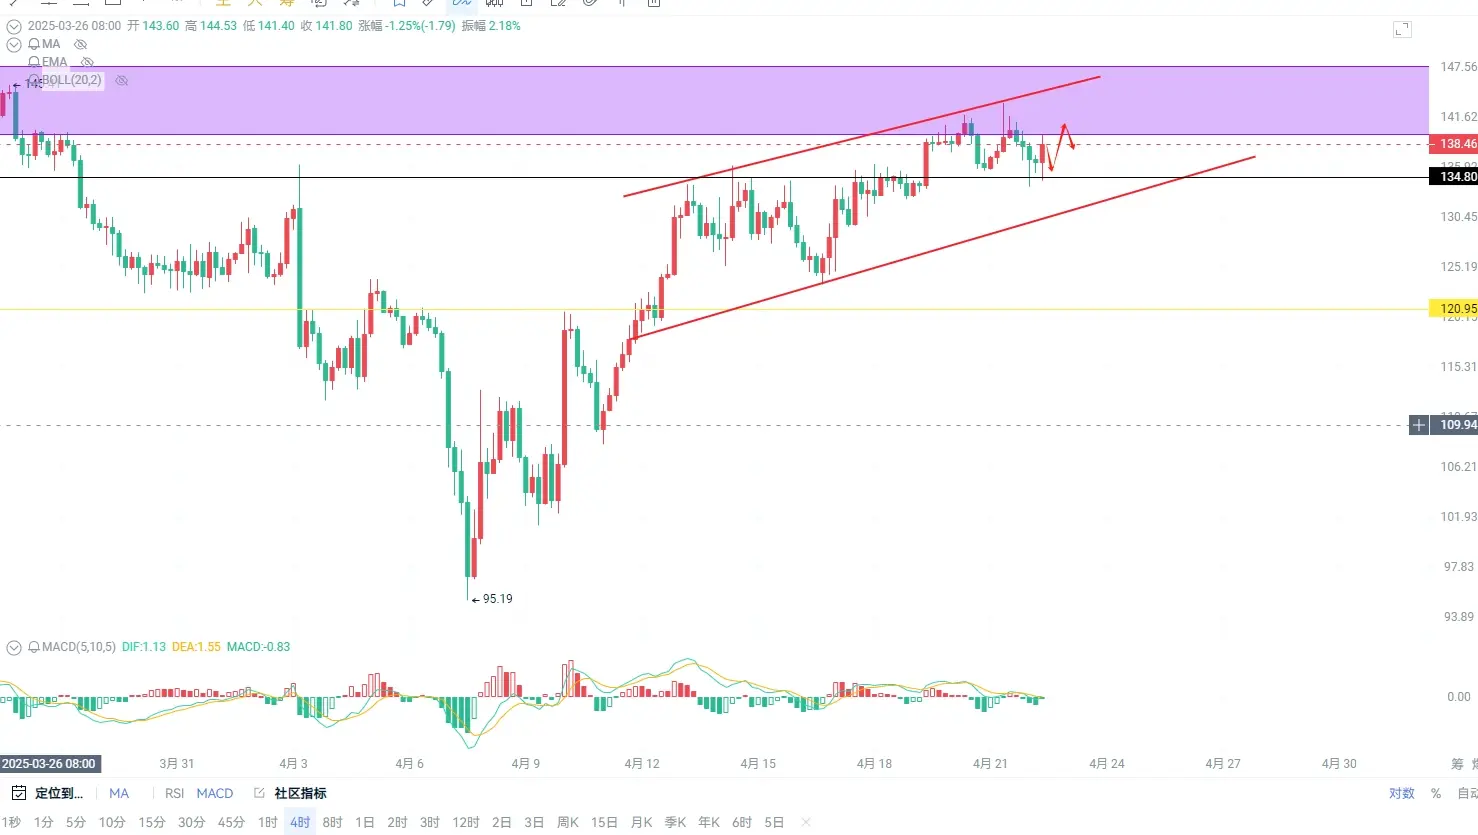
April 22: Pay attention to the 50 moving average on the four-hour level for Solana: If it doesn't break here, buy on dips and go north.
The Solana daily chart shows that the lowest point has dropped to around 95, where it has stopped falling and is making a V-shaped rebound, reaching a key position. There is significant resistance in the range of 140-147. If it can break through smoothly, the price could further push up to the range of 170-177. On the downside, pay attention to 133; as long as it doesn't break below, a pullback is expected to head north. The 4-hour candlestick chart has formed
View OriginalThe Solana daily chart shows that the lowest point has dropped to around 95, where it has stopped falling and is making a V-shaped rebound, reaching a key position. There is significant resistance in the range of 140-147. If it can break through smoothly, the price could further push up to the range of 170-177. On the downside, pay attention to 133; as long as it doesn't break below, a pullback is expected to head north. The 4-hour candlestick chart has formed
- Reward
- like
- Comment
- Share
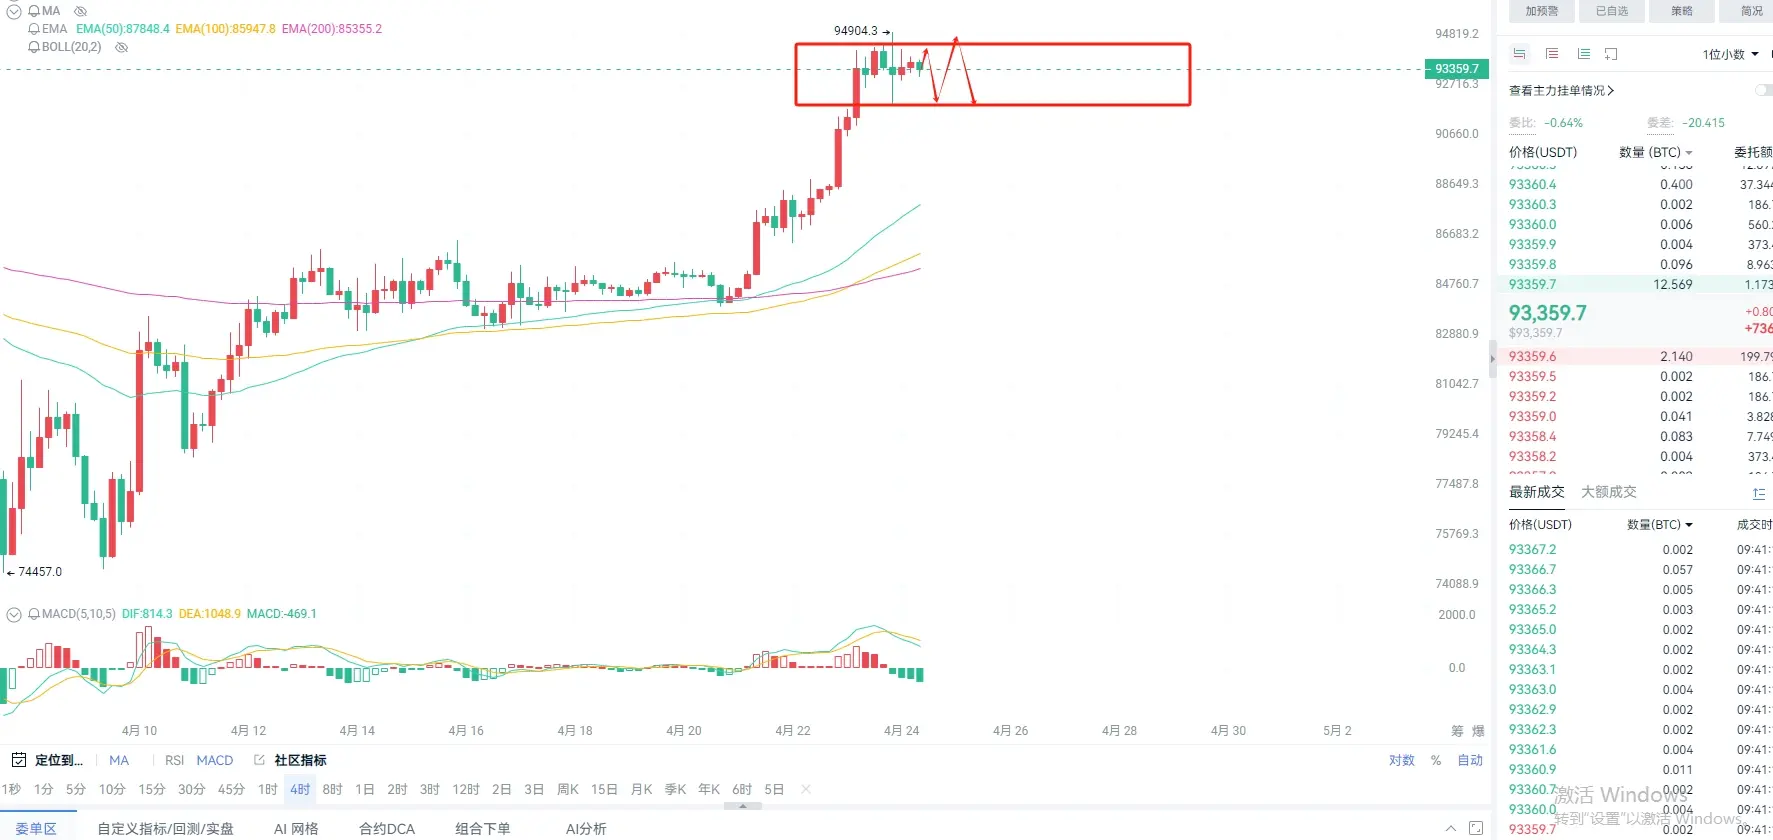
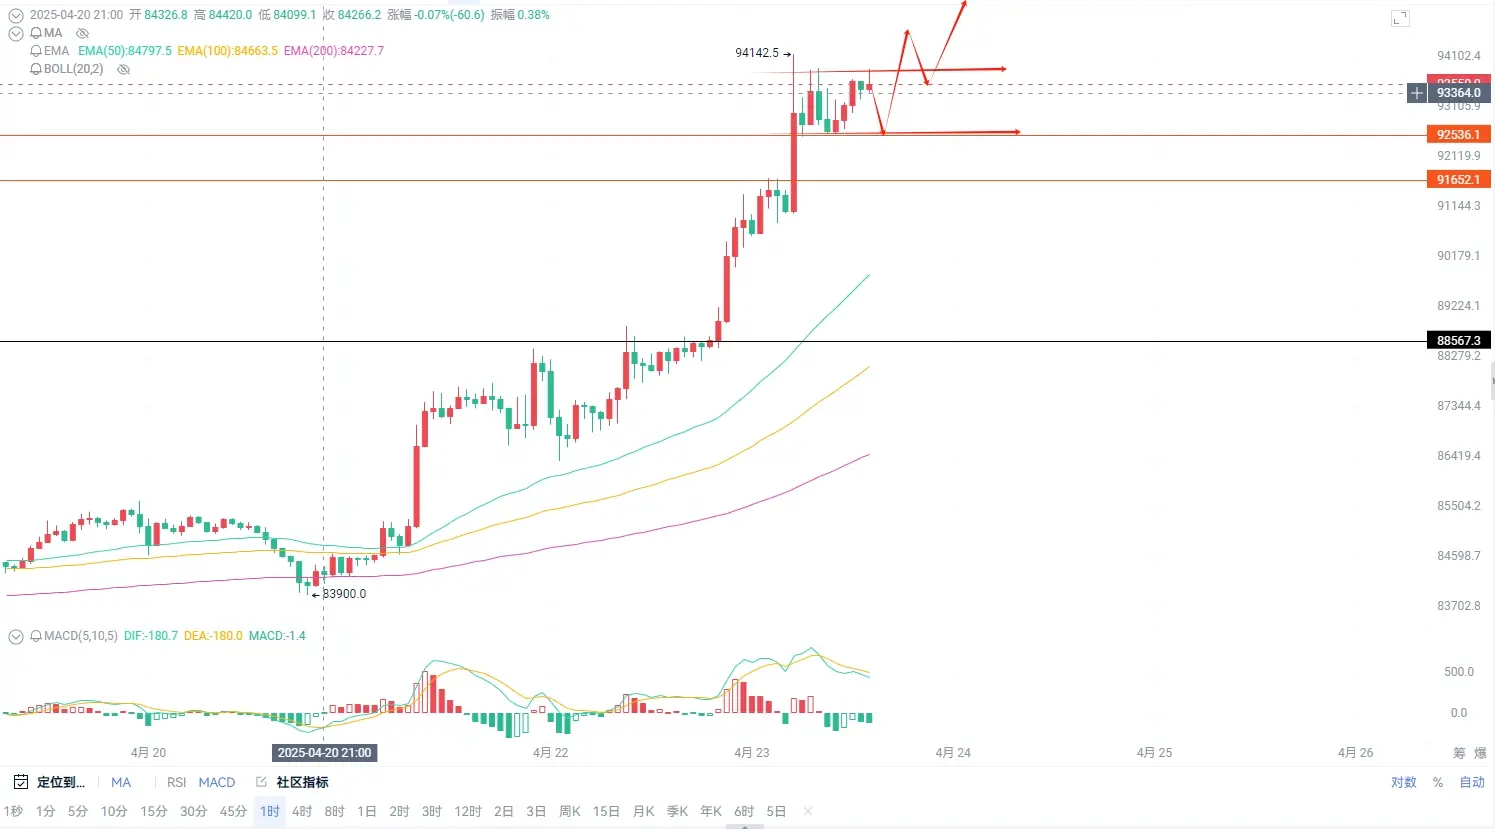
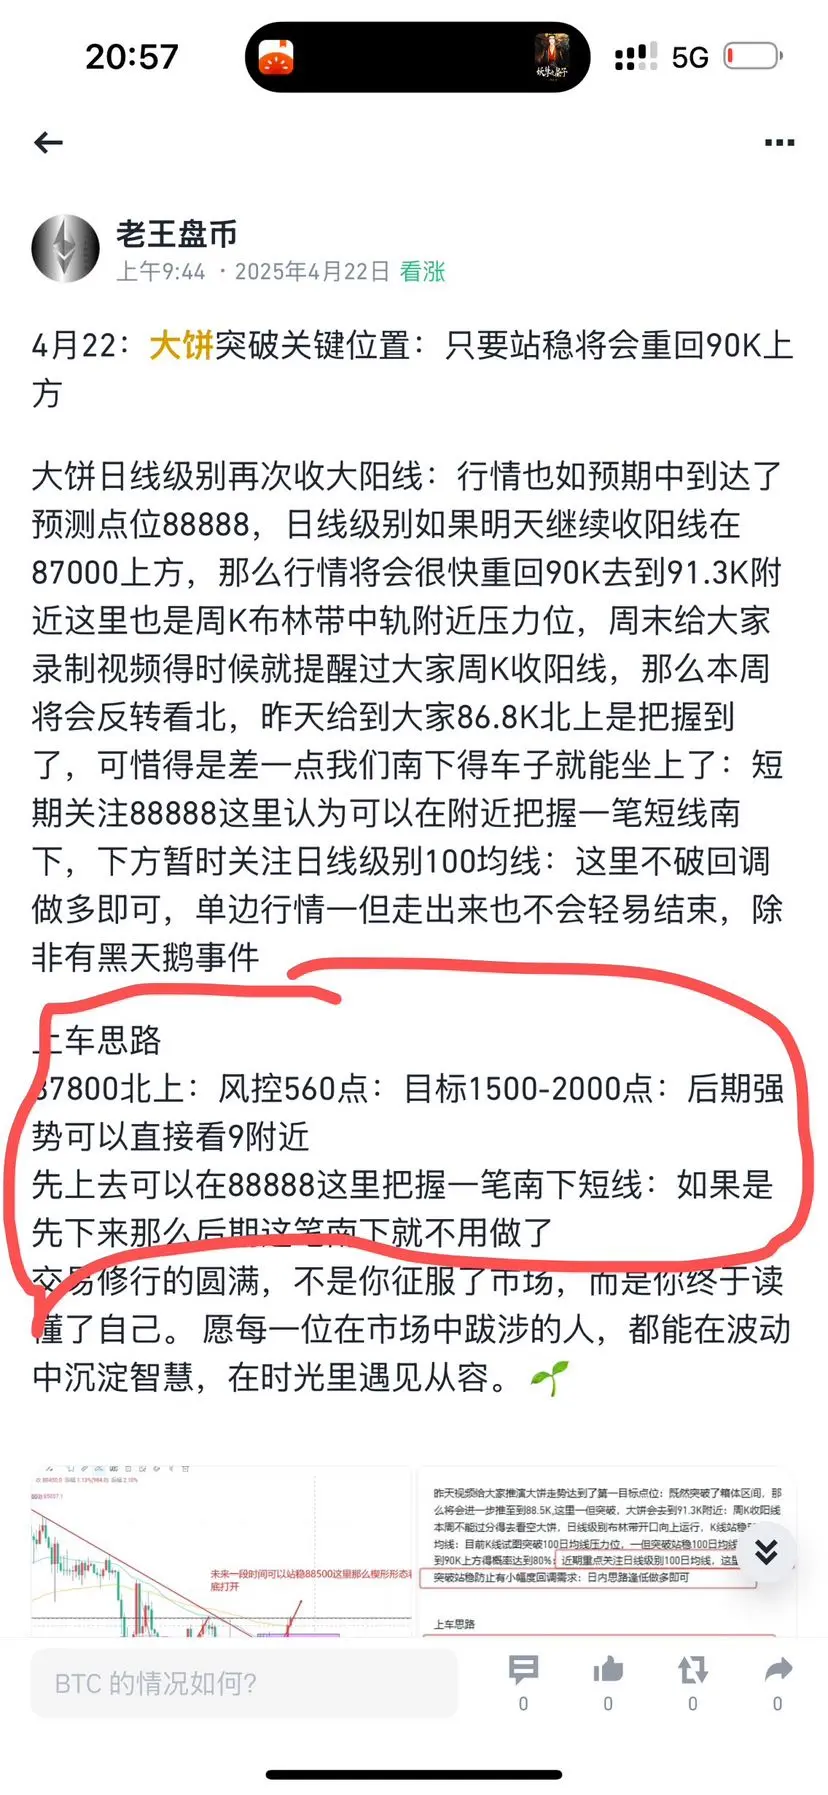
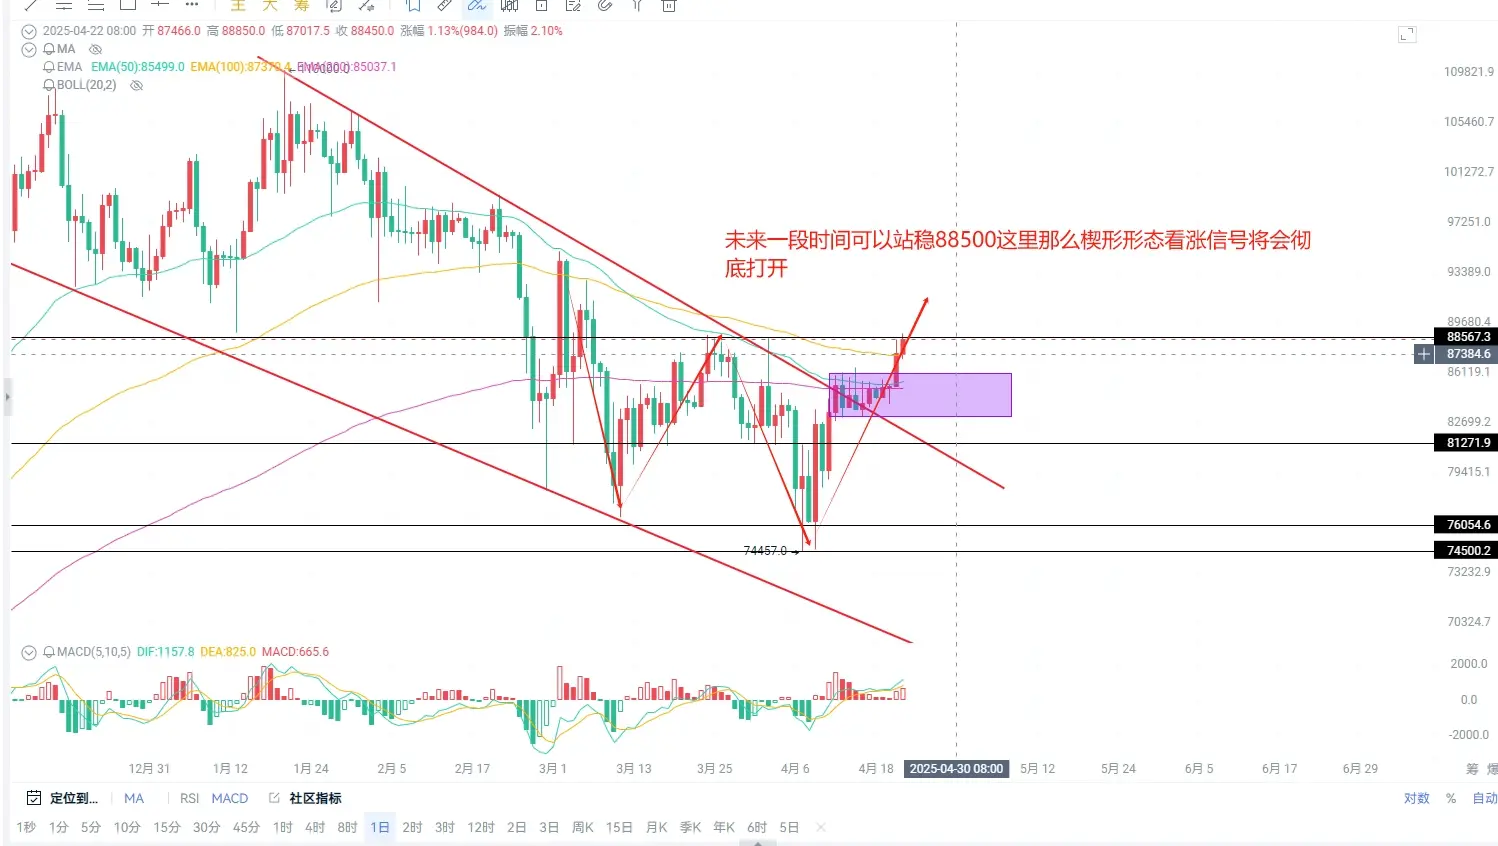
April 22: BTC breaks through a key position: as long as it stabilizes, it will return above 90K.
BTC daily level once again closed with a large bullish candle: The market has reached the predicted point of 88888 as expected. If the daily level continues to close bullish above 87000 tomorrow, the market will quickly return to 90K, approaching around 91.3K, which is also near the middle band resistance of the weekly Bollinger Bands. I reminded everyone during the video recording over the weekend that if the weekly candle closes bullish, then this week will reverse to the upside. Yesterday, the u
View OriginalBTC daily level once again closed with a large bullish candle: The market has reached the predicted point of 88888 as expected. If the daily level continues to close bullish above 87000 tomorrow, the market will quickly return to 90K, approaching around 91.3K, which is also near the middle band resistance of the weekly Bollinger Bands. I reminded everyone during the video recording over the weekend that if the weekly candle closes bullish, then this week will reverse to the upside. Yesterday, the u
- Reward
- like
- Comment
- Share
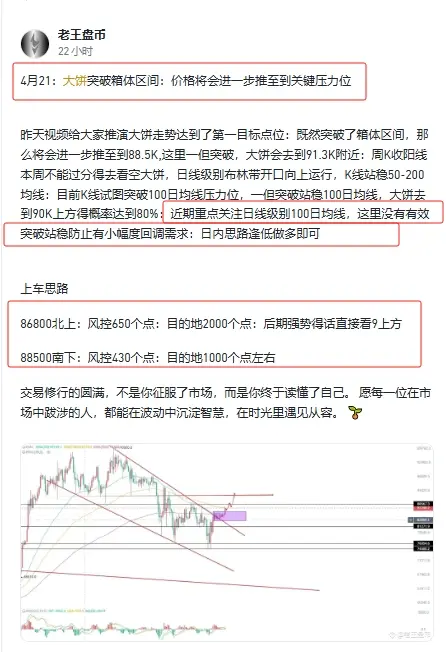
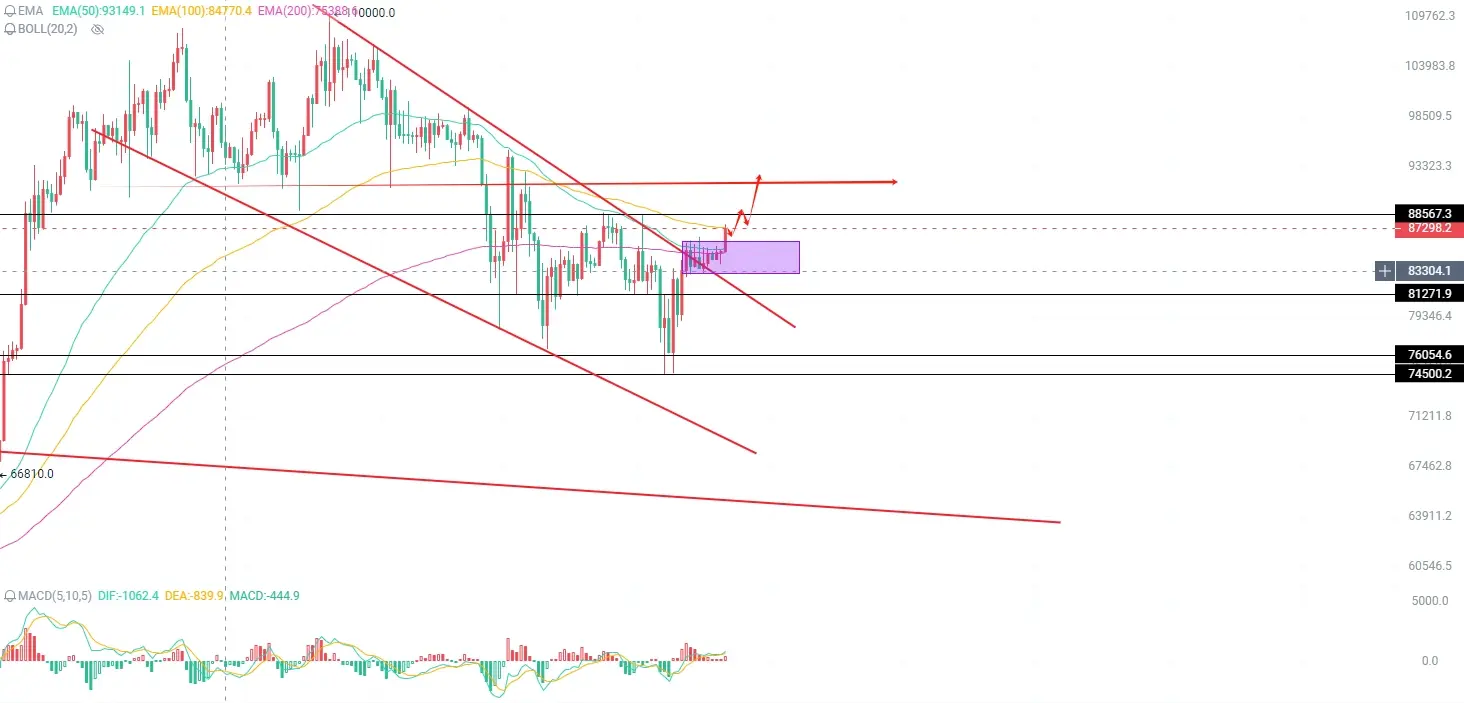
April 21: BTC breaks through the trading range: the price will further push towards the key resistance level.
Yesterday's video demonstrated that BTC's trend reached the first target level: since it broke through the trading range, it will further push to 88.5K. If it breaks through here, BTC will go to around 91.3K: the weekly K line closed with a bullish candle, so we shouldn't overly bearish on BTC this week. The daily Bollinger Bands are opening upwards, and the K line is firmly above the 50-200 moving averages: currently, the K line is trying to break through the 100-day moving average re
View OriginalYesterday's video demonstrated that BTC's trend reached the first target level: since it broke through the trading range, it will further push to 88.5K. If it breaks through here, BTC will go to around 91.3K: the weekly K line closed with a bullish candle, so we shouldn't overly bearish on BTC this week. The daily Bollinger Bands are opening upwards, and the K line is firmly above the 50-200 moving averages: currently, the K line is trying to break through the 100-day moving average re
- Reward
- like
- Comment
- Share
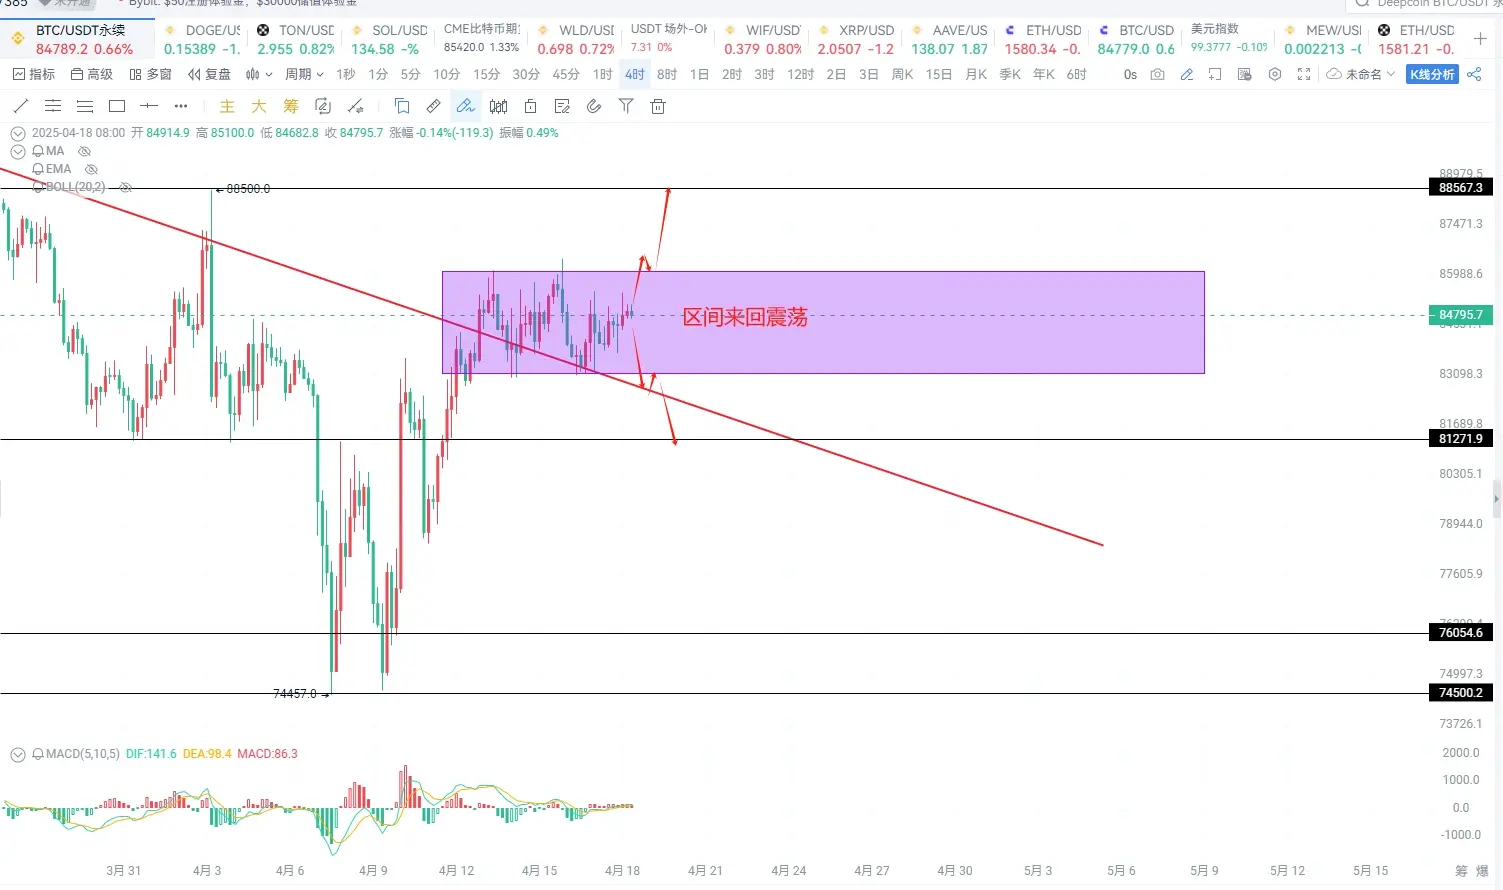
The morning of April 18: The flatbread continues to shake and the grinding pan dog village releases water? You have to be patient to break the game
In the past few days, I believe that many brothers have gained a good harvest in this shock grinding market, and the pie has been maintained in the 86000-83000 range for shock adjustment: if the market breaks through the box range above, then the pie will be further pushed to 88500, on the contrary, the fall below the box range will be pushed to the 81300-80000 range: the daily level Bollinger band gradual opening pattern indicates that the market
View OriginalIn the past few days, I believe that many brothers have gained a good harvest in this shock grinding market, and the pie has been maintained in the 86000-83000 range for shock adjustment: if the market breaks through the box range above, then the pie will be further pushed to 88500, on the contrary, the fall below the box range will be pushed to the 81300-80000 range: the daily level Bollinger band gradual opening pattern indicates that the market
- Reward
- like
- Comment
- Share
Bitte币需求在 ETF 流出和矿工担忧的背景下反弹,引发市场稳定性质疑
随着波动性重现,围绕比特币的市场情绪发生了显有转变。 Bittat 币高级情绪指数目前为44.9% ,跌破中性区间,这使得看跌情绪成为焦点。 考虑到中月市场情绪仍维持在70% 接觸的较为乐观的水平,這次跌幅意义重大。
The bits recently jumped to $88,000 on April 2, but fell sharply to $74,500 shortly thereafter. 这种过山车式的价格波动凸显了市场当前的动荡,进一步加剧了投资者在权衡下一步行动时的谨慎态度。
机构投资者对比特币的参与度显有减弱,加剧了市场普遍的焦虑情绪。 现货ETF持仓大幅减少,从3月的119万枚 BTC向下April 初的111.5万枚BTC 。 这一跌broke through 1116067 枚BTC的关键警戒线,引发了人们对机构投资者大幅撤资的担忧。
此次後退表明,与 2024 年大部分时间观察到的 ETF 持续增持趋势有所不同。 尽管一些散户兴趣似乎正在重新燃起,但机构信心的削弱可能会对比特币的价格稳定构成长期挑战。
此外,矿工的行为表明他们持有谨慎的比特币,矿工持仓指数 (MPI)在短短 24 小时内飙升近40。 这种增长通常表明矿工正在出售部分持仓,无论是为了获利了结还是为潜在的价格跌做
BTC0.61%

- Reward
- like
- Comment
- Share
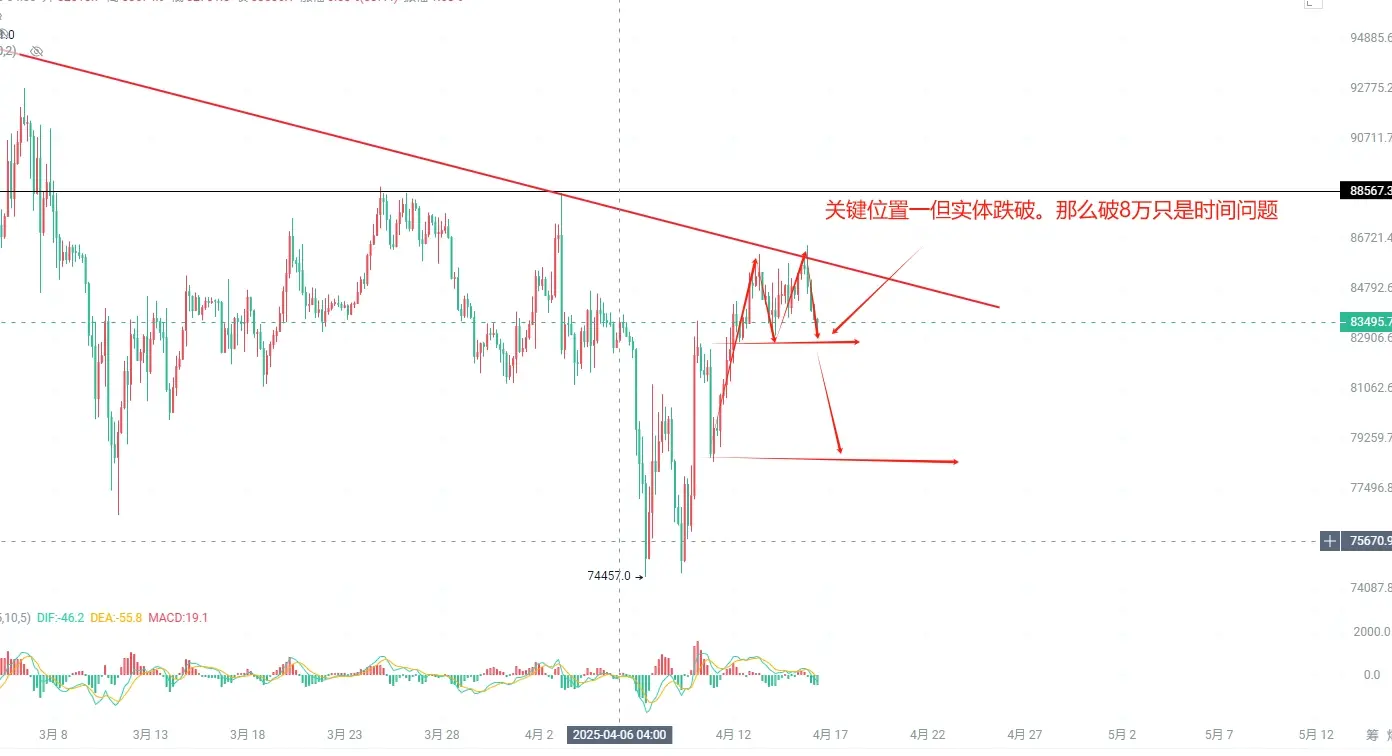
April 16: The four-hour level M top structure is initially formed: Will the neckline fall?
The daily line level closed a long yin upper shadow line above the surface of the selling pressure is serious, yesterday the old Wang gave everyone two south, the second south to pinch 3000 points, this callback trend north to get the car is definitely not necessary to go on, if it is in 83000 here to win that is not bad, I have to short single still hold in the middle of this short single Wang will get to break 80,000, that is, the four-hour level M top completely formed will go to the position, the dai
The daily line level closed a long yin upper shadow line above the surface of the selling pressure is serious, yesterday the old Wang gave everyone two south, the second south to pinch 3000 points, this callback trend north to get the car is definitely not necessary to go on, if it is in 83000 here to win that is not bad, I have to short single still hold in the middle of this short single Wang will get to break 80,000, that is, the four-hour level M top completely formed will go to the position, the dai
BTC0.61%
- Reward
- like
- Comment
- Share