Mantra (OM) Latest Update: July Rebound Sparks New High Surge
In July 2025, Mantra Crypto News highlighted OM token’s remarkable rally, as its price surged nearly 100% in just one month. OM is currently trading around 0.278 USDT. This article explores the drivers behind this movement and provides insights into what’s next for OM.
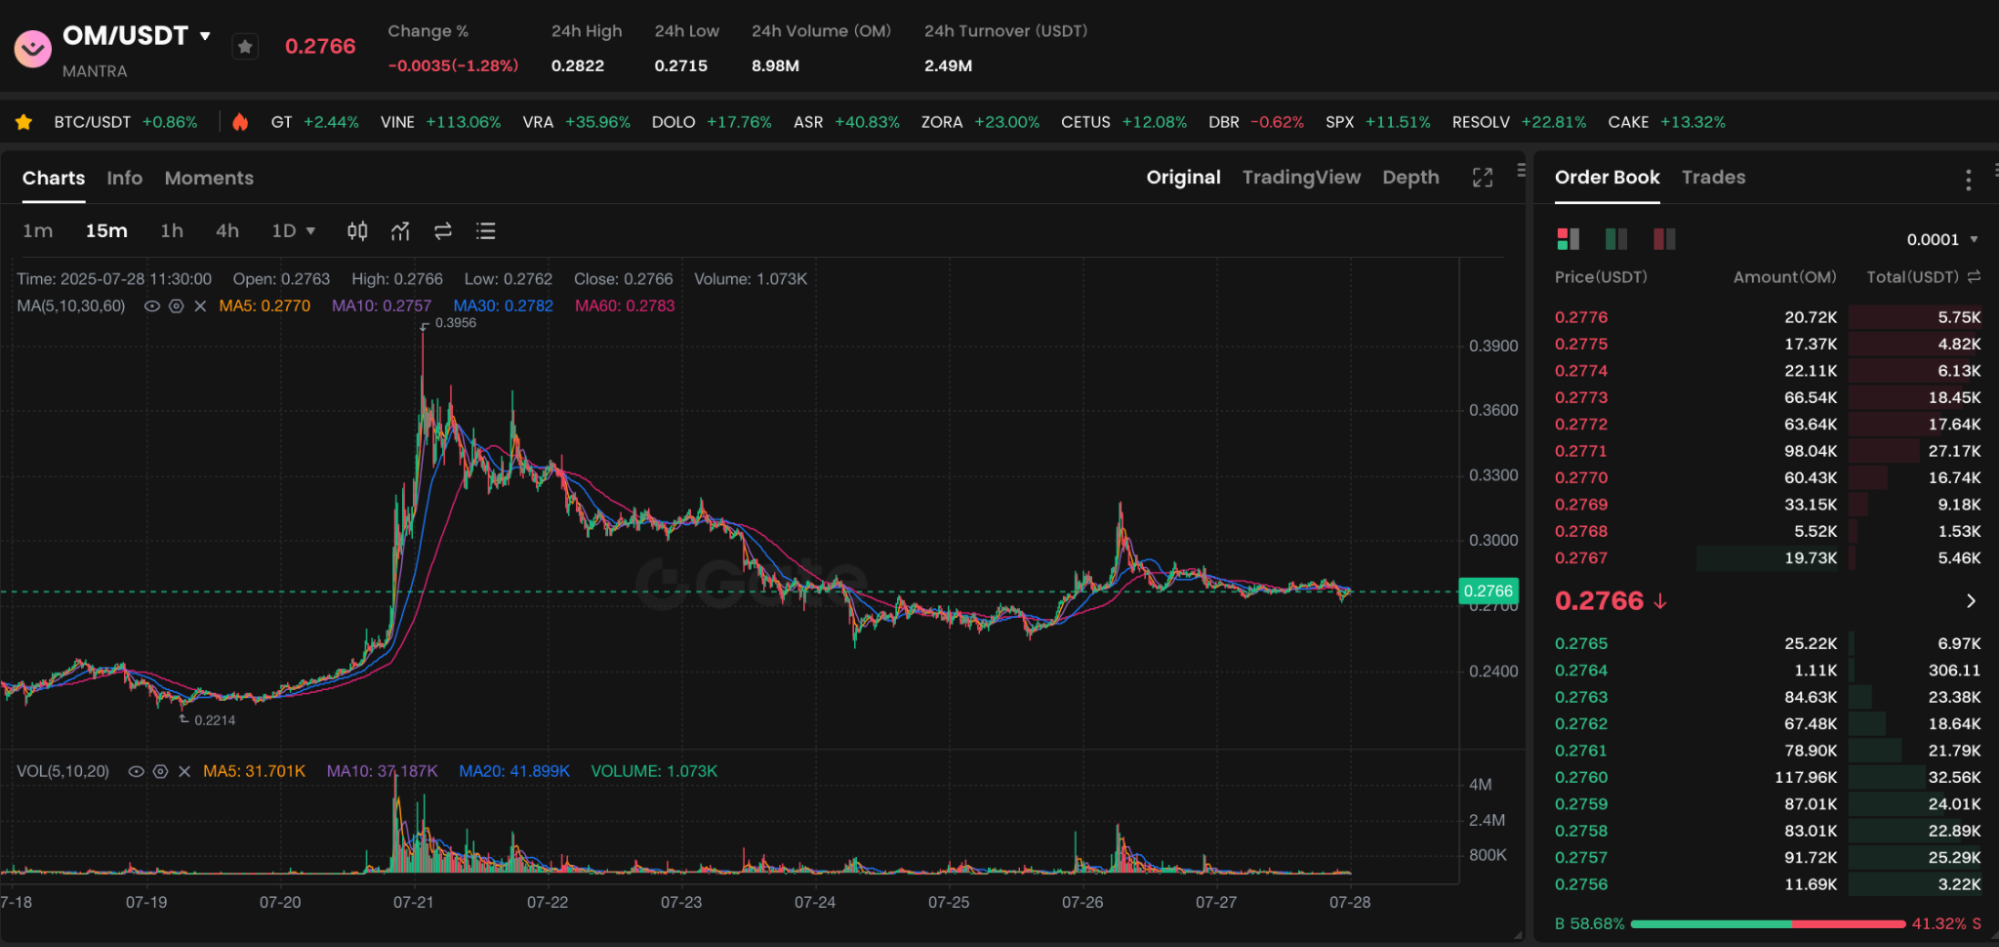
Chart: https://www.gate.com/trade/OM_USDT
OM returned to the spotlight in summer 2025. After a flash crash in April that pulled OM below 0.30 USDT, the token staged an impressive rebound in July. It nearly doubled in value for the month. OM’s current price is approximately 0.278 USDT. It has been fluctuating within the 0.2715–0.2822 USDT range. Over the past 24 hours, OM posted a trading volume of 8.99 million and a trading volume of roughly 2.49 million USDT.
OM Price Trend Analysis
The daily chart shows OM initiating a sustained uptrend from July 1. On July 20, the price action formed a classic bullish engulfing pattern, signaling further momentum. At the time of writing, OM trades back near 0.278 USDT, having doubled from its early July lows. Liquidity is recovering as 24-hour trading volume increases nearly 40% week-over-week, accompanied by robust growth in trading activity.
Key Factors Behind the July Rally
- Macro recovery: Leading cryptocurrencies like Bitcoin and Ethereum have strengthened, improving overall market sentiment and drawing capital back into mid-cap projects.
- Project catalysts: According to 99Bitcoins, OM surged nearly 100% in July. The team reiterated its commitment to technology upgrades and compliance milestones, helping restore community confidence.
- Speculative momentum: Social media and crypto communities are fueling “buy the dip” sentiment, making projects that previously experienced flash crashes particularly appealing.
Technical Overview and Market Sentiment
Technically, OM’s 14-day Relative Strength Index (RSI) climbed out of oversold territory to around 60, accompanied by rising trading volumes. Short-term moving averages have turned bullish, and Bollinger Bands have widened after a period of contraction, indicating a return of volatility. Sentiment indicators shifted from April’s panic to a neutral-to-bullish outlook; bullish sentiment prevails.
Balancing Risks and Opportunities
Despite OM’s strong short-term performance, investors should be mindful of several risks:
- Potential for another downturn: If major cryptocurrencies correct, OM could decline as well.
- Liquidity risk: Large-scale sell-offs at elevated levels could swiftly break bullish momentum.
- Regulatory uncertainty: Tightening global compliance policies may introduce systemic risks.
Nevertheless, with disciplined position management, new investors might consider staggered entry strategies. It is advisable to limit OM exposure to no more than 5% of the overall portfolio.
Outlook and Investment Strategies
Looking ahead, if Bitcoin and other market leaders remain in a bull phase, OM could challenge the 0.40 USDT mark. It may even set new highs. Reaching major resistance levels may present an opportunity for investors to realize profits. Investors should also monitor project governance developments, on-chain data, and sentiment shifts closely, adjusting their holdings as needed.
Related articles

Pi Coin Transaction Guide: How to Transfer to Gate.io

What is N2: An AI-Driven Layer 2 Solution

Grok AI, GrokCoin & Grok: the Hype and Reality

How to Sell Pi Coin: A Beginner's Guide

Crypto Trends in 2025
