

Drweb3
I am an FVG (Fair Value Gap) trader, and I analyze the forex and crypto markets based on FVG. My trades depend on daily and 4-hour candlesticks.
Drweb3
Unlock Crypto Riches with Gate.io’s Web3 BountyDrop Hey crypto adventurers Ready to dive into the exciting world of Web3 and score some sweet rewards? Gate.io’s BountyDrop is your golden ticket to earning crypto NFTs and exclusive whitelist spots just by completing fun and simple tasks!
Gate.io’s BountyDrop is a one stop hub for Web3 airdrop projects that is shaking up the crypto space in 2025. Whether you are a blockchain newbie or a seasoned bounty hunter this platform makes it super easy to join high potential projects across chains like Ethereum Solana and Base. From following X accounts
Gate.io’s BountyDrop is a one stop hub for Web3 airdrop projects that is shaking up the crypto space in 2025. Whether you are a blockchain newbie or a seasoned bounty hunter this platform makes it super easy to join high potential projects across chains like Ethereum Solana and Base. From following X accounts

- Reward
- 1
- Comment
- Repost
- Share
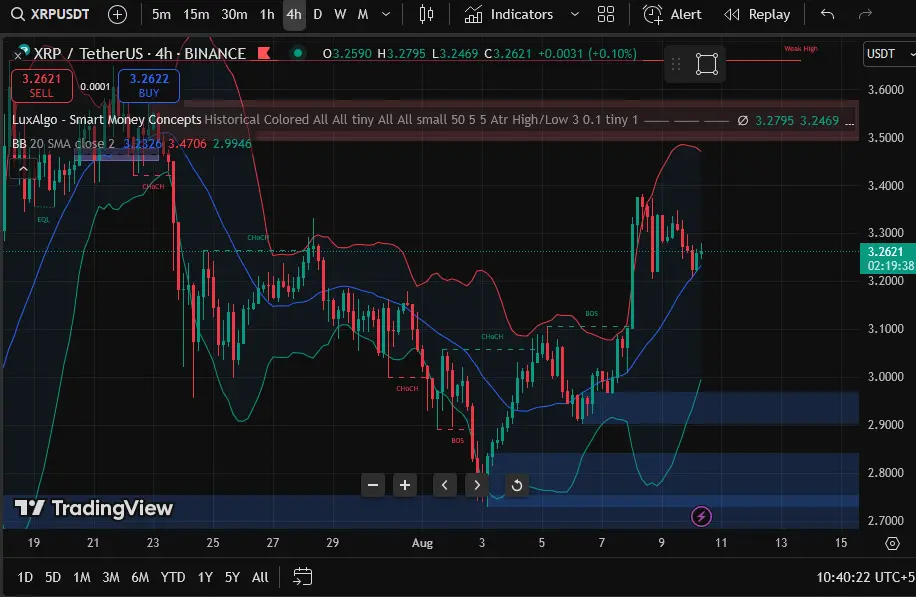
The price perfectly fulfilled my previous idea. XRPUSDT is holding above the 3.1500 support zone after a clean rebound from the ascending trendline signaling a bullish continuation setup. The structure remains intact with higher lows, and the next major objective lies in the 3.8000 resistance zone. A breakout above 3.4000 could open the way for accelerated upside movement. Trend bias remains bullish while price holds above key support.
Key Levels
Buy trigger: Break above 3.4000
Buy zone: 3.1000–3.2000
Target: 3.8000
Invalidation: Drop below 3.000
Risks
A breakdown under 3.0000 could shi
Key Levels
Buy trigger: Break above 3.4000
Buy zone: 3.1000–3.2000
Target: 3.8000
Invalidation: Drop below 3.000
Risks
A breakdown under 3.0000 could shi
- Reward
- like
- Comment
- Repost
- Share
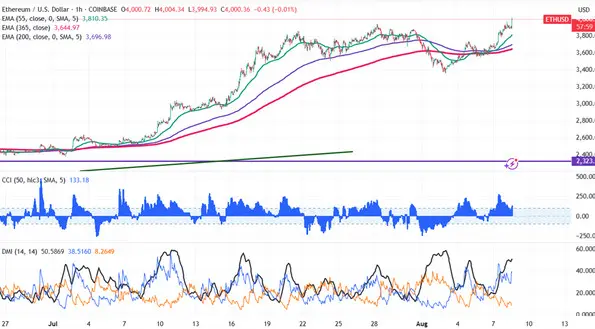
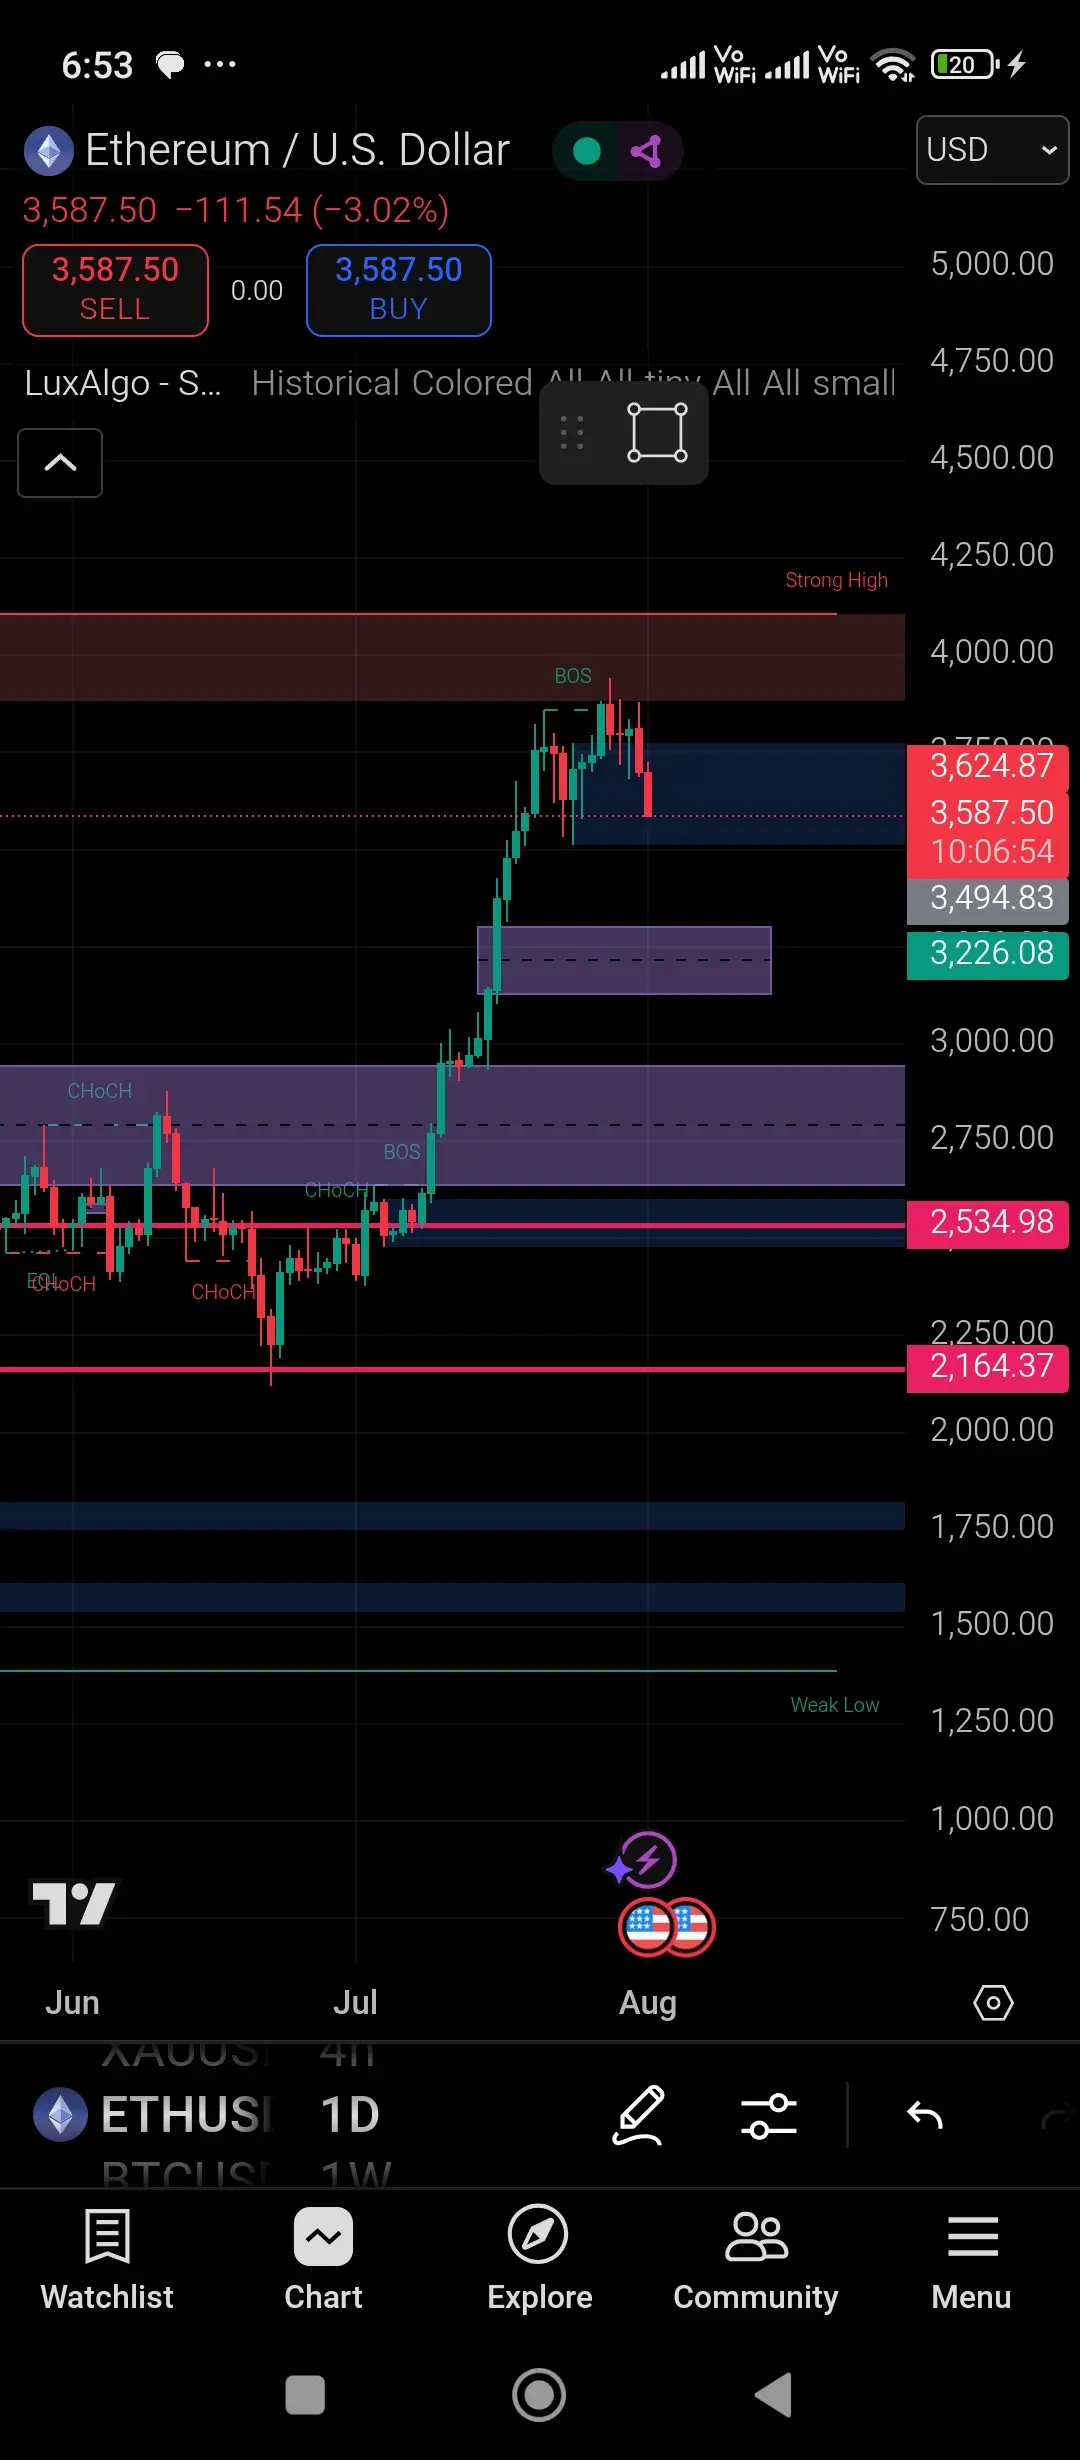
Ethereum Surges Past $4000, Backed by SharpLink's Bullish Bets
Early August 2025 SharpLink made a bold move adding another 22000 ETH to its bag taking total holdings past 521000 ETH worth nearly 2 billion USD
This was fueled by a 200 million direct share sale showing how traditional companies are now treating ETH as a strategic asset
Almost all of SharpLink holdings are staked and earning yield and the news helped push ETH price up 7 percent to break the 3900 level
ETHUSD has now smashed through the key 4000 resistance after a long period of consolidation touching an intraday high of 4013 and
- Reward
- 6
- 3
- Repost
- Share
CalmDown:
Is it now considered to hold above 4100?View More
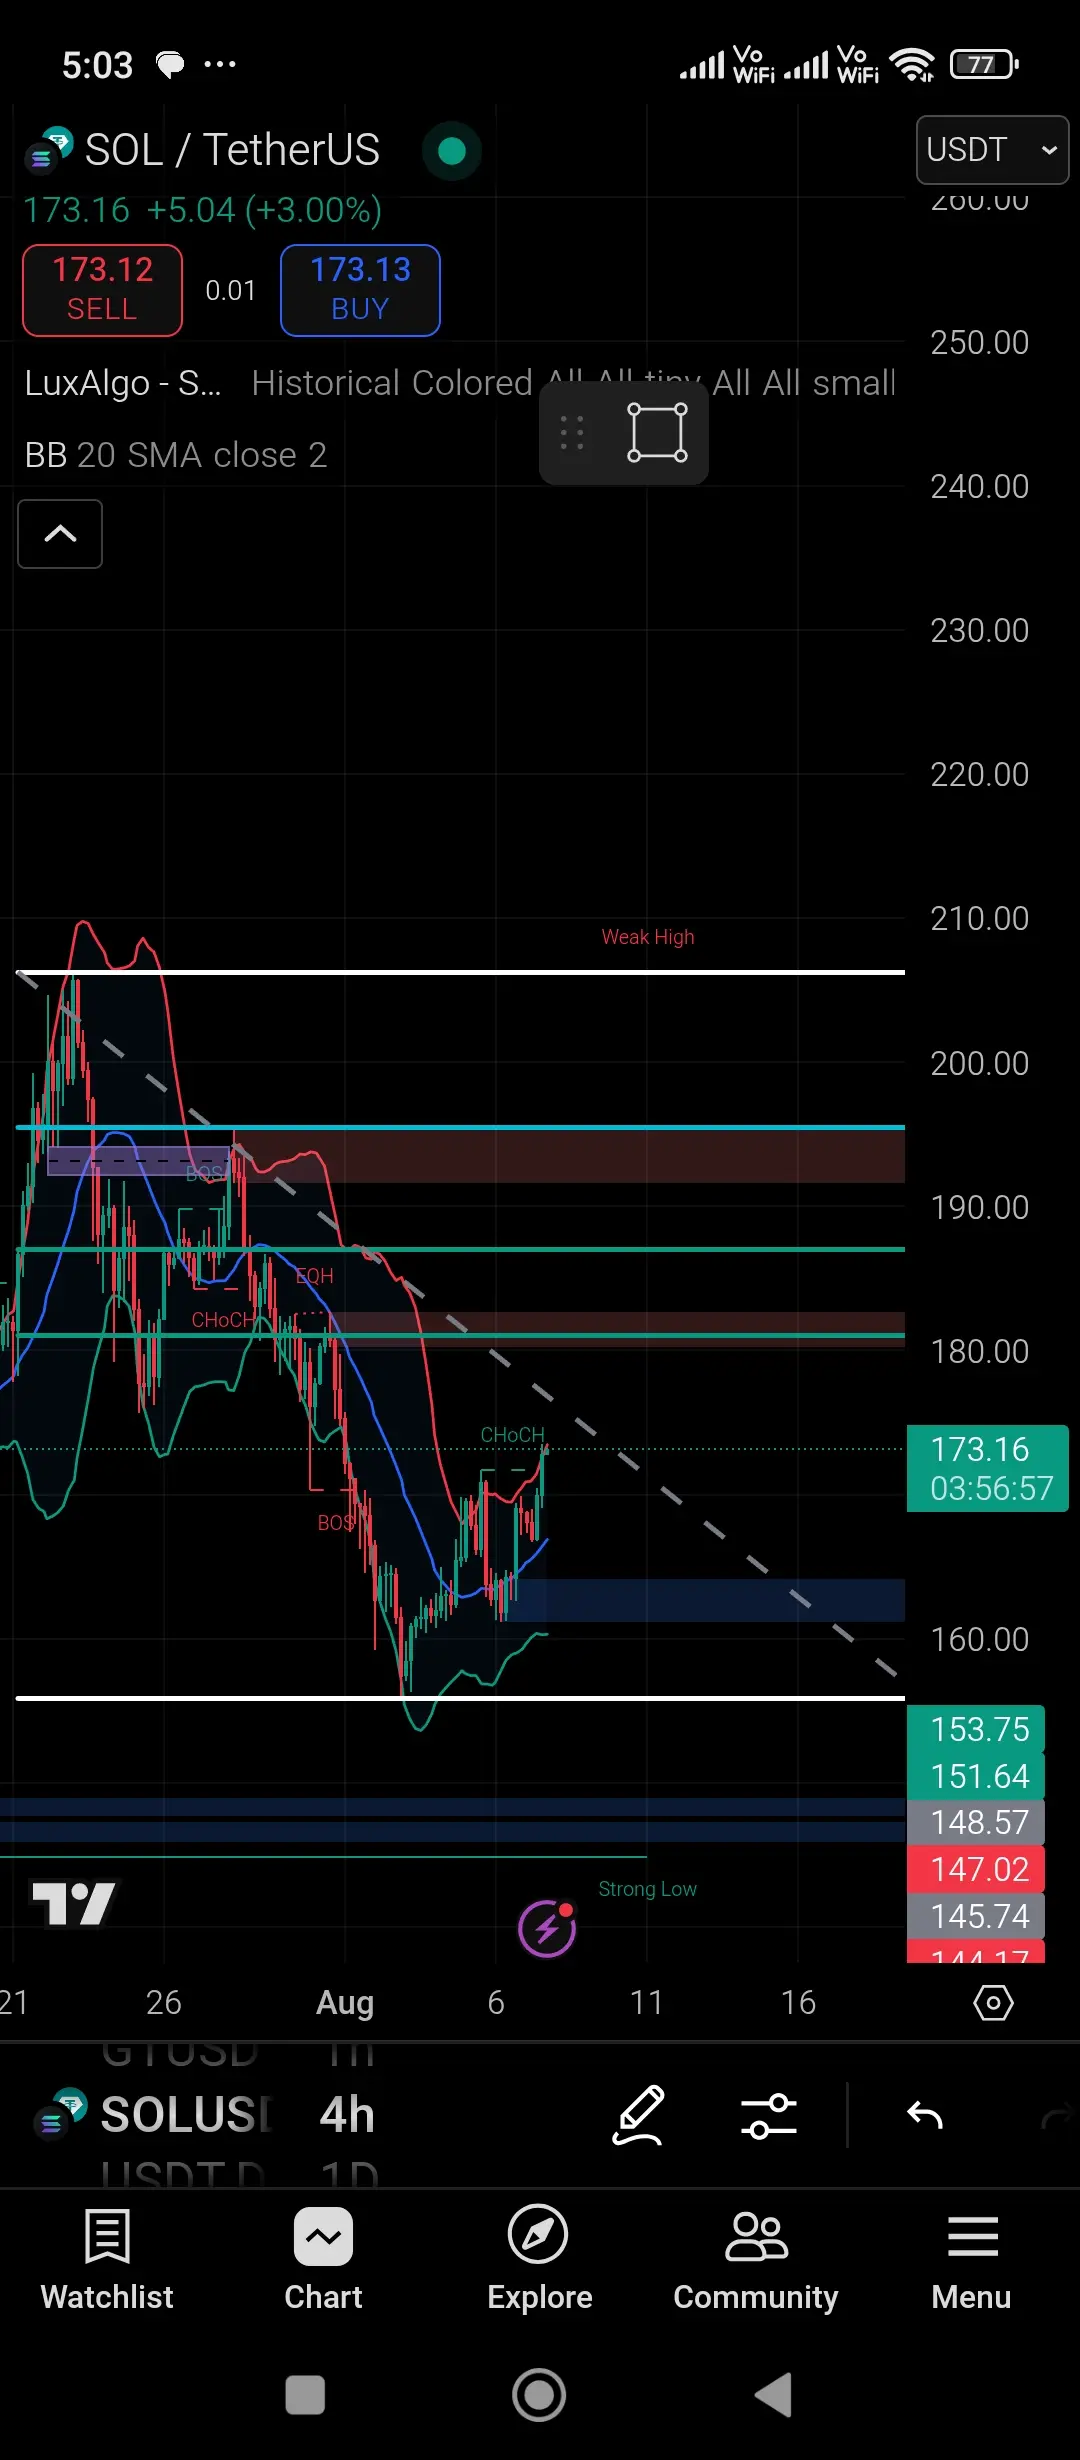
SOL/USDT 4H chart
Chart Analysis Summary
Current Price: ~$173.16
Trend: Recent Change of Character (CHoCH) to the upside, suggesting a bullish move might be forming.
Indicators:
Price is approaching a major supply zone between $180–$190.
Descending trendline still intact – being tested now.
20 SMA (blue) is now acting as dynamic support.
CHoCH suggests break in bearish structure.
Trade Setup: Long (Buy) Option
Entry Options:
1. Conservative Entry: On a confirmed break and close above $175, then entry on retest.
2. Aggressive Entry (current): Anywhere between $172–$174, as it approaches tren
- Reward
- like
- Comment
- Repost
- Share
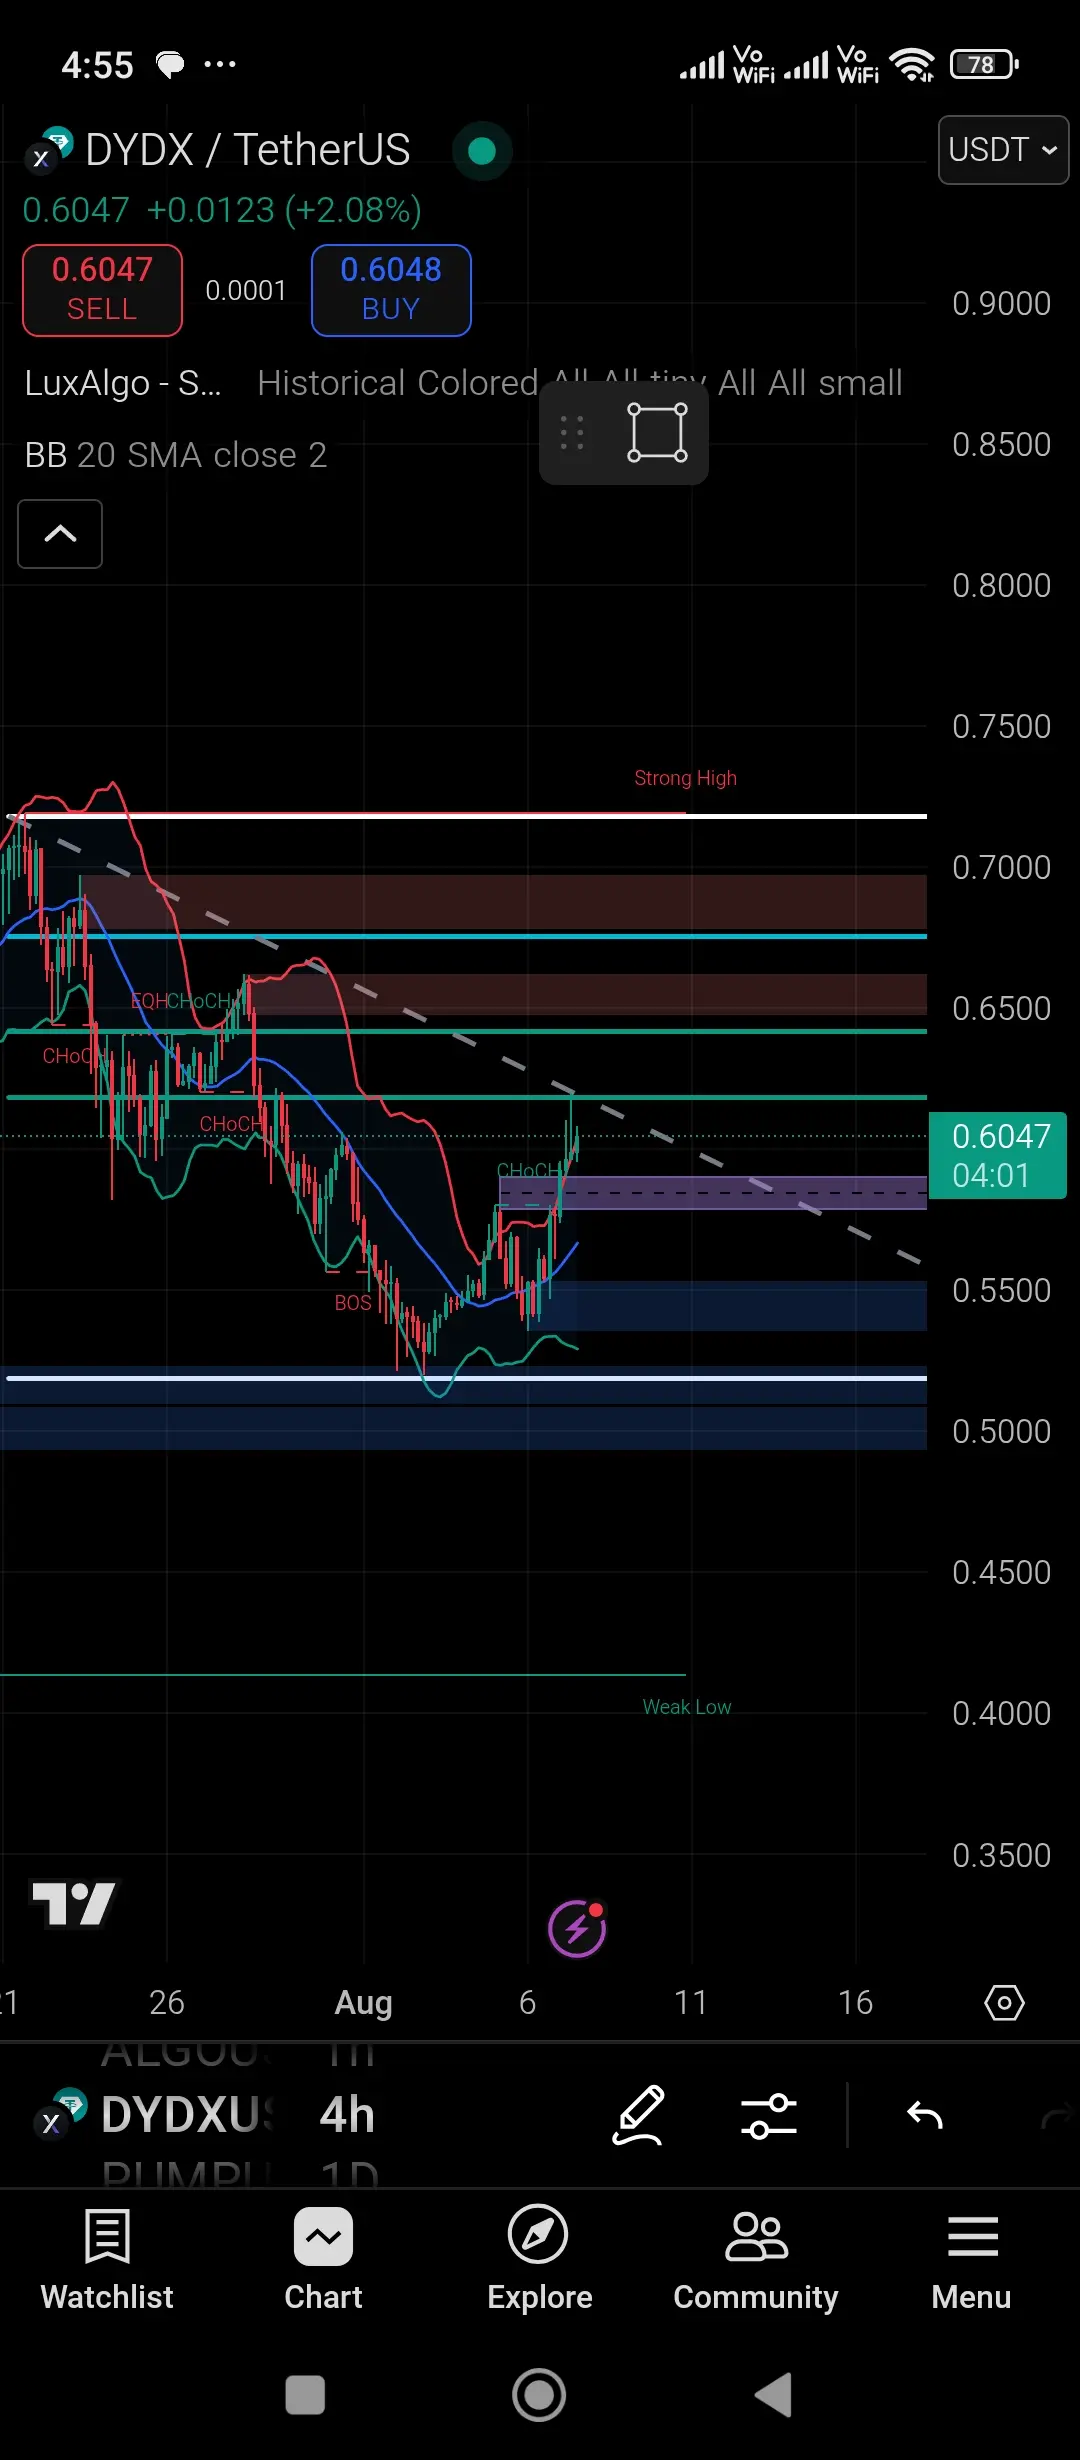
DYDX/USDT 4H
Chart Analysis Summary
Current Price: ~0.6047 USDT
Trend: Recently broke structure (CHoCH), showing a bullish move.
Indicators:
Break of structure (BOS) confirmed near ~0.5400 USDT.
Price is above the 20 SMA and testing previous supply.
Price is at a key resistance (upper bound of CHoCH zone).
Zones:
Demand (Support): 0.5400–0.5600 USDT
Supply (Resistance): 0.6400–0.6800 USDT
Descending trendline: Still valid, but currently being tested.
✅ Trade Setup: Long Position
Entry Zone:
Ideal Entry: Around 0.5900–0.6050 USDT
Currently testing resistance, wait for slight pullback or confi
- Reward
- like
- Comment
- Repost
- Share
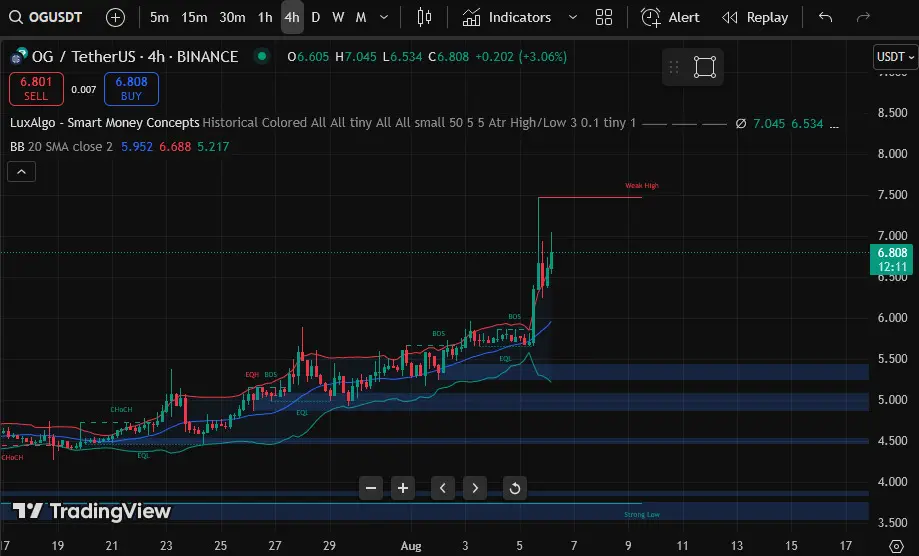
$OG is trading near 5.46 today slipping about 5.6 % percent in the past 24 hours Support is sitting around 6.22 while resistance is up at 6.94 A clean break above that level could open the door for a bigger move upward However the RSI is flashing overbought vibes so we might see a brief cooldown before any strong push higher
- Reward
- like
- Comment
- Repost
- Share
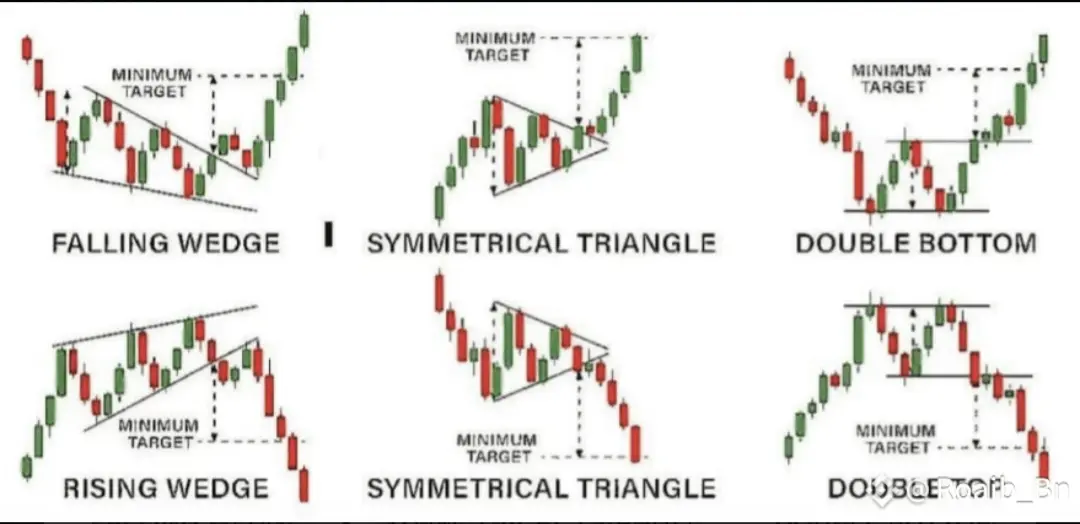
LEARN THIS CANDLES PATTERNS THEN YOU WILL NEVER FACE LOSSES IN CRYPTO
1- Falling Wedge (Bullish)
Price compresses downward in a wedge.
Breakout upward signals bullish reversal.
Minimum target = wedge height.
2-Symmetrical Triangle (Bullish)
Price consolidates forming equal triangle slopes.
Breakout in direction of trend (usually bullish).
3- Double Bottom
Two equal lows forming “W” pattern.
Breakout above neckline confirms bullish reversal.
4- Rising Wedge (Bearish)
Price rises inside narrowing wedge.
Breakout downward = bearish reversal.
5- Symmetrical Triangle (Bearish)
Appears during do
WHY-5.92%
- Reward
- like
- Comment
- Repost
- Share
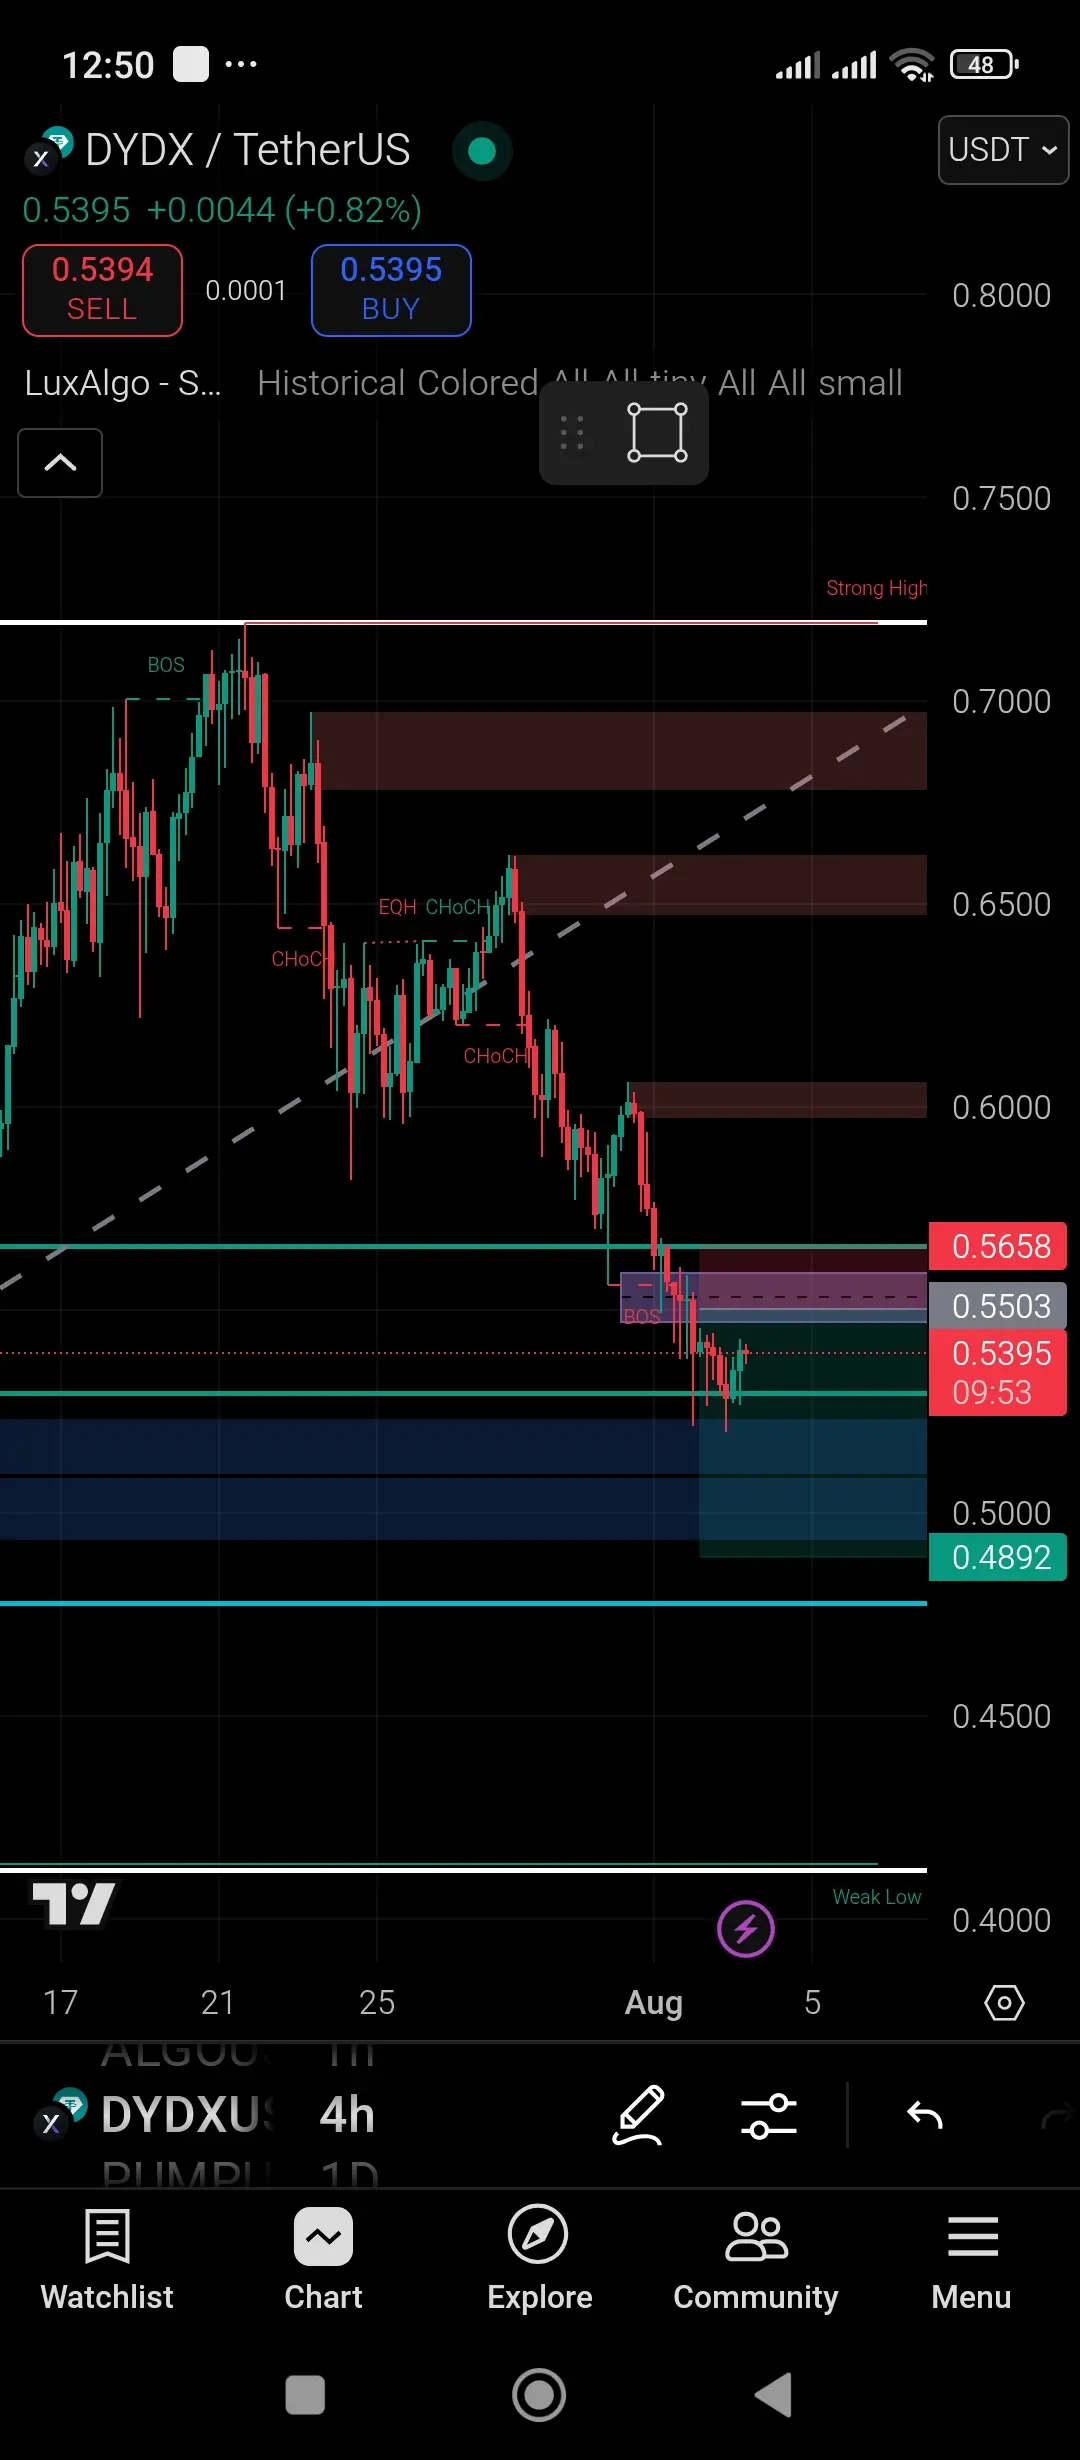
Downtrend confirmed: multiple CHoCH (Change of Character) and BOS (Break of Structure) show bearish momentum.
Price is currently reacting below a supply zone (~$0.5503–0.5658).
Strong demand zone is visible around $0.4892–0.5000.
Price recently tapped into that lower demand zone and is showing minor rejection.
Price is currently reacting below a supply zone (~$0.5503–0.5658).
Strong demand zone is visible around $0.4892–0.5000.
Price recently tapped into that lower demand zone and is showing minor rejection.
- Reward
- 1
- Comment
- Repost
- Share
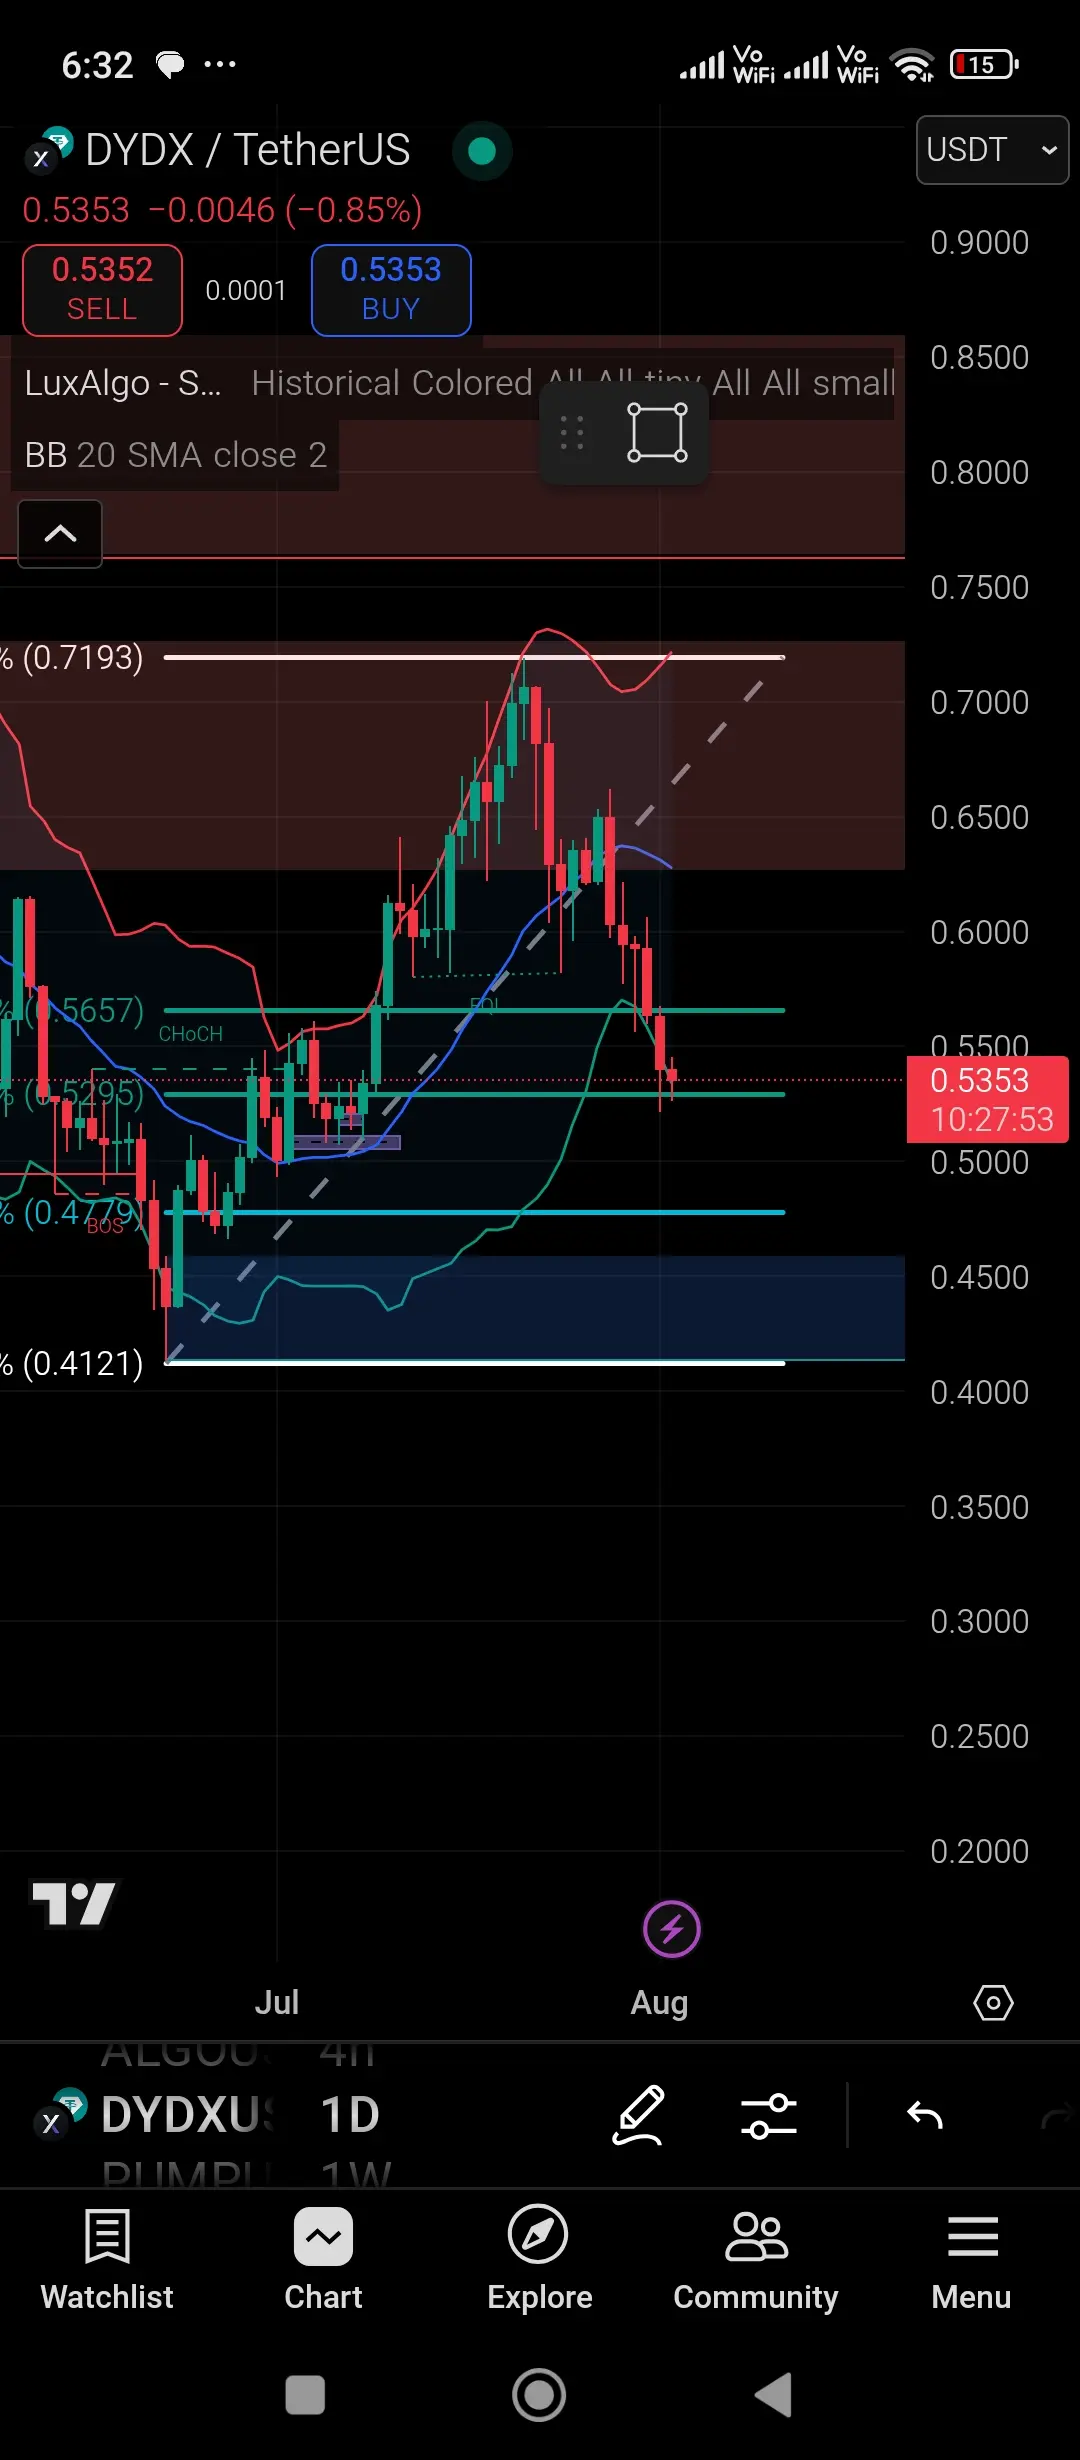
DYDX/USDT daily chart
Current Price: $0.5353
Trend: Recent bearish move after rejection from ~0.71
Support Zones:
$0.5250 (minor)
$0.4780 (key demand zone / structure support)
$0.4120 (strong historical demand)
Resistance Zones:
$0.5660 (previous support flipped resistance)
$0.6300–0.6600 (supply area)
Indicators:
Price below 20 SMA (bearish)
Bollinger Bands widening – potential increased volatility
Price testing mid-structure support zone
Entry Level Strategy
🔹 Option 1: Conservative (Safer)
Entry: ~$0.4780 (bounce from demand zone)
Stop Loss: $0.4080 (below previous low)
Target 1: $0.5660
- Reward
- 6
- 3
- Repost
- Share
GateUser-d61883b6:
very good bro fighting✌️View More
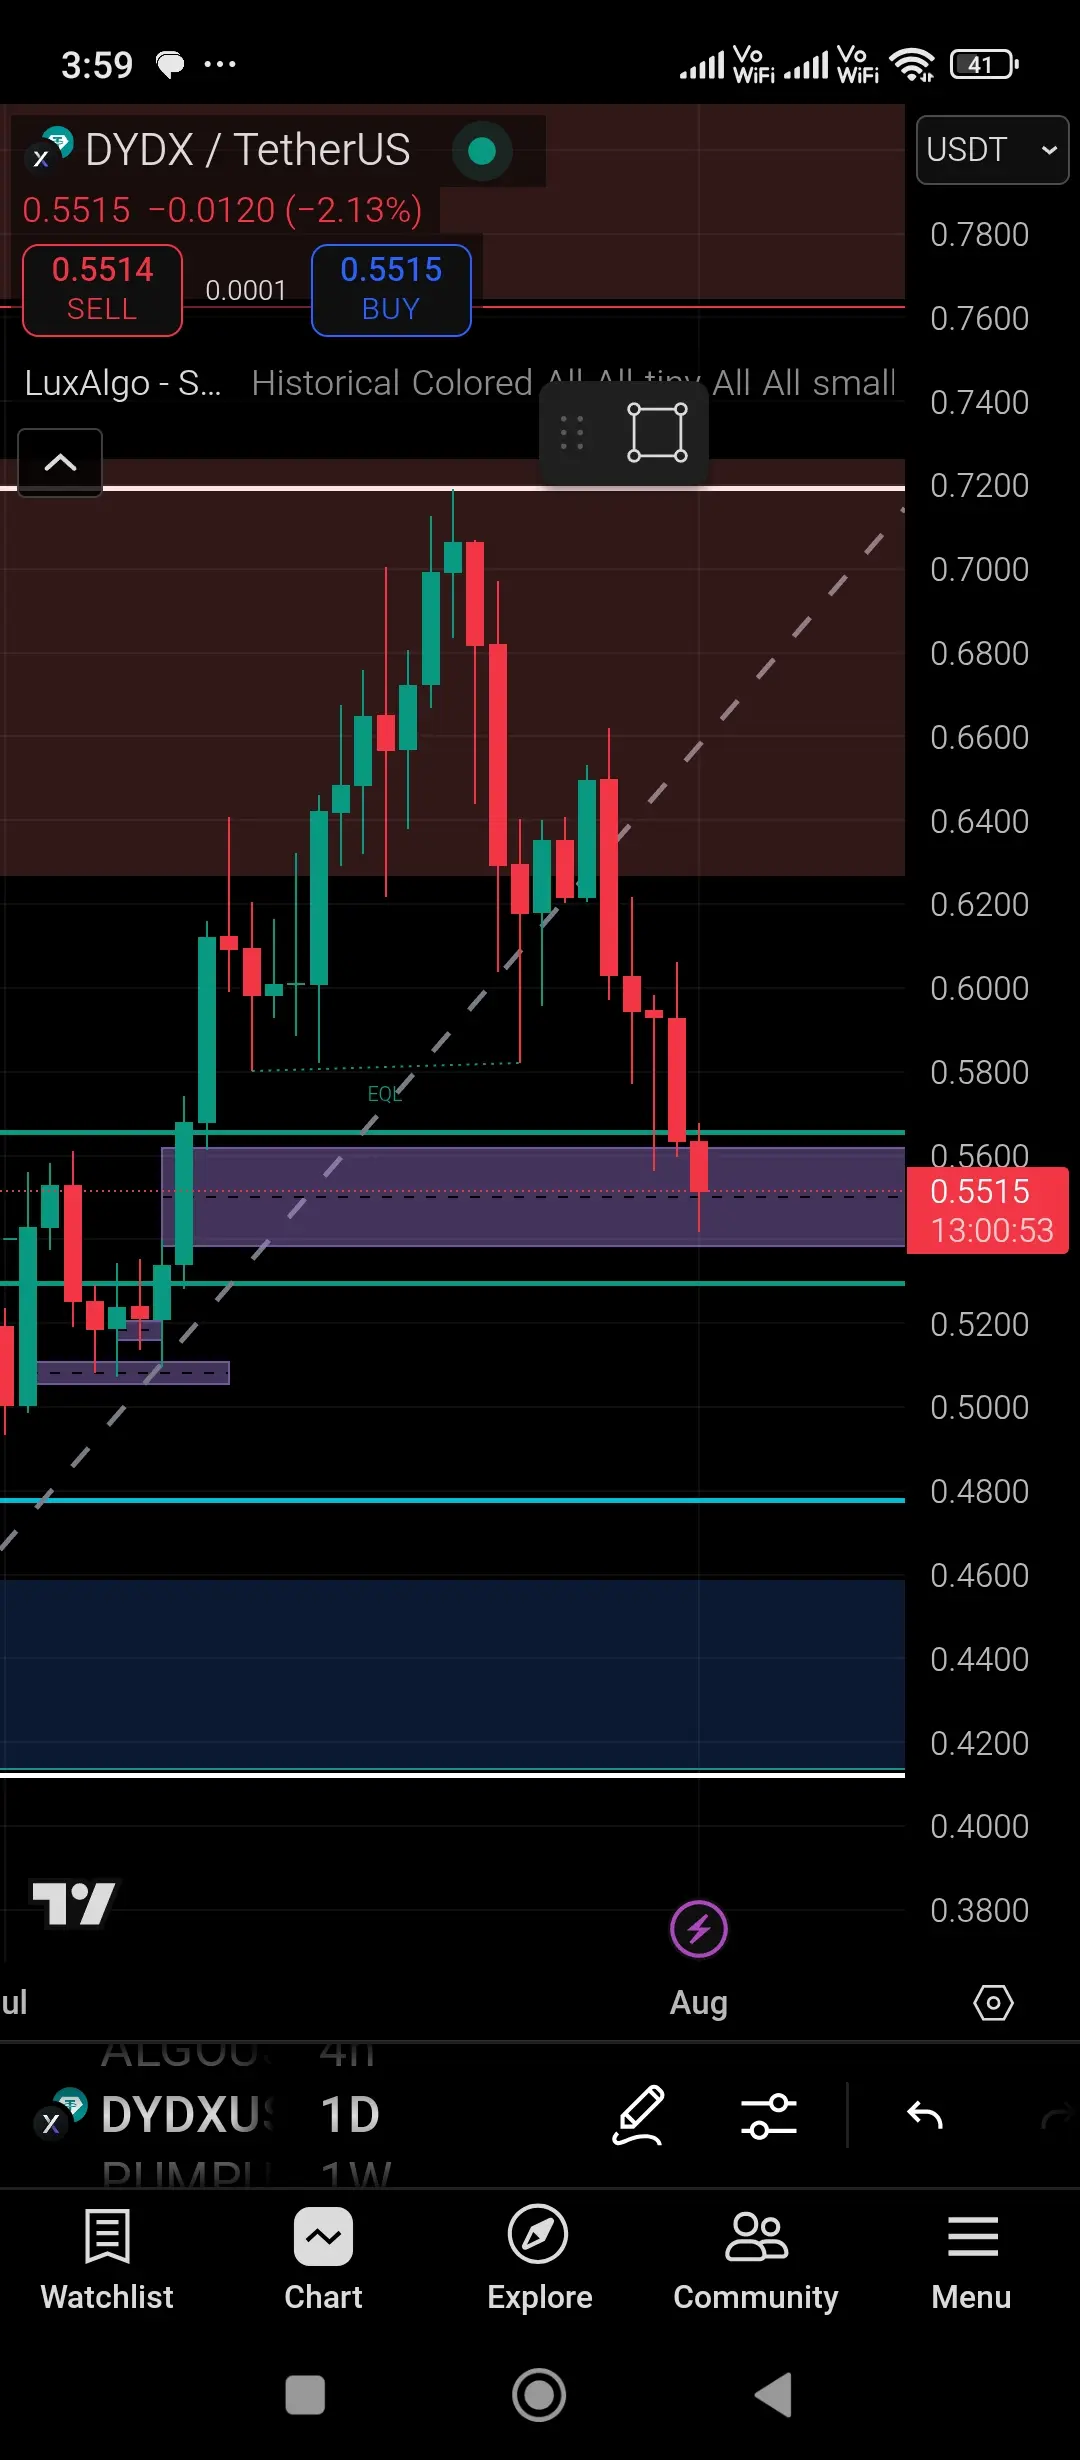
(DYDX/USDT on the 1D timeframe), here’s a technical analysis for a potential short-term trade setup:
Market Context:
The price is in a clear downtrend, forming lower highs and lower lows.
It recently broke below the support zone (purple box ~0.555–0.565), indicating bearish momentum.
The candle is currently retesting the broken support as potential new resistance (a classic bearish confirmation).
Possible Trade Setup (Short Bias):
Entry (Sell/Short):
Around $0.555 - $0.560
Wait for bearish confirmation at this level (e.g., a bearish engulfing or rejection wick on lower timeframes like 4H).
Ta
- Reward
- like
- Comment
- Repost
- Share
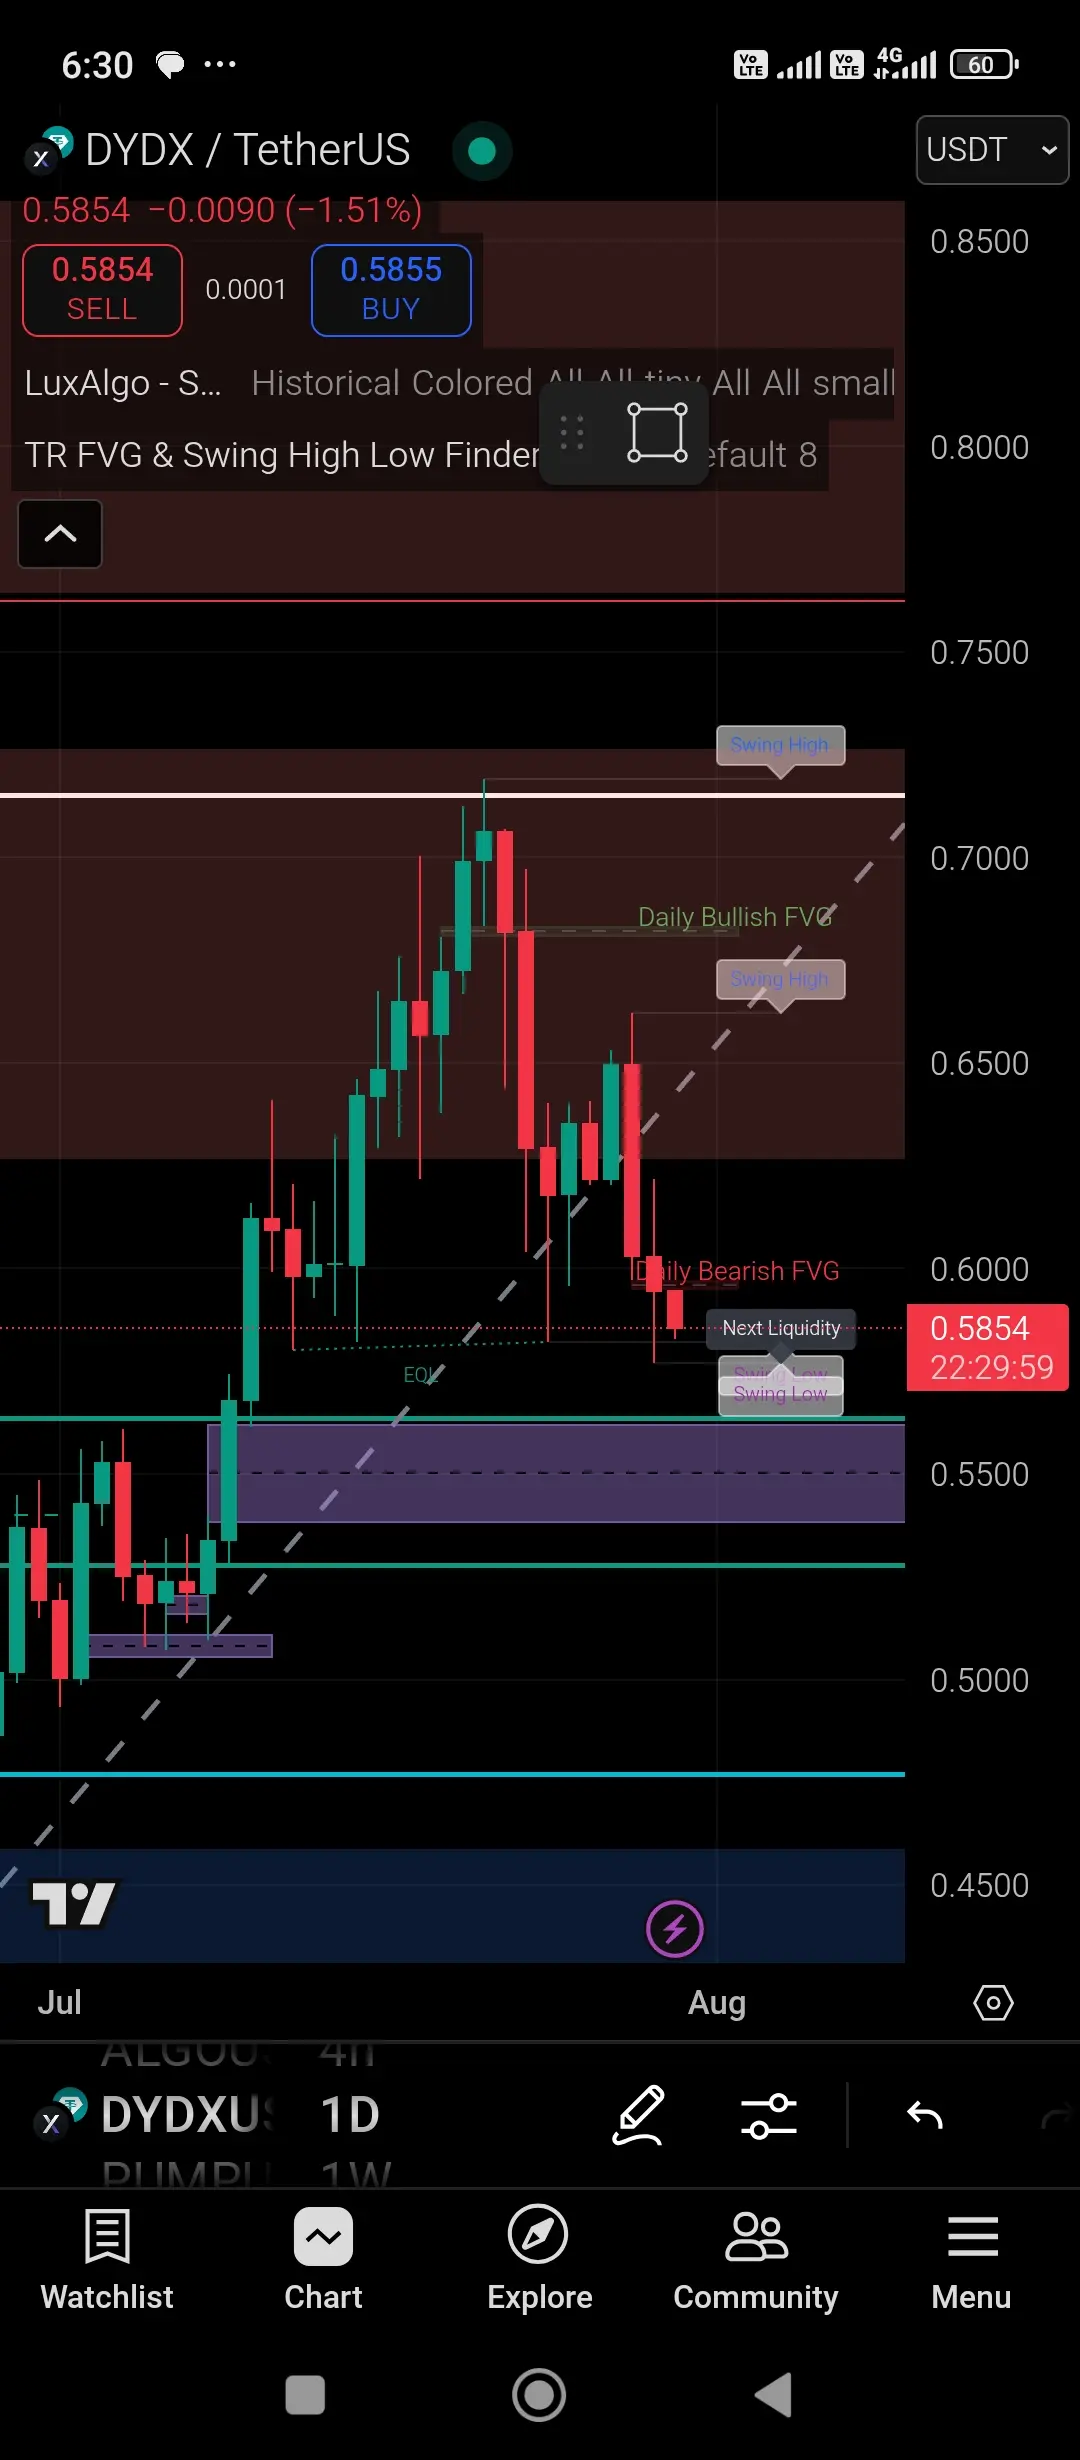
DYDX/USDT 1D chart and the visible price action and fair value gaps (FVGs)
Chart Analysis Summary
Current Price: 0.5854 USDT
Trend: Bearish short-term (lower highs & lower lows)
Key Levels Identified:
Daily Bearish FVG Zone: ~0.59 to ~0.62
Daily Bullish FVG Zone: ~0.68 to ~0.73
Liquidity Level / Swing Low: ~0.57
Demand Zone (Support): ~0.52 to ~0.55 (purple box)
Overall structure: Price is reacting from the bearish FVG and approaching the liquidity zone and demand area.
🟢 Long (Buy) Setup
Entry Level: Between 0.52 – 0.55 USDT (inside the purple demand zone)
Take Profit (TP)
TP1: 0.59 USDT (F
- Reward
- like
- Comment
- Repost
- Share
- Reward
- like
- Comment
- Repost
- Share
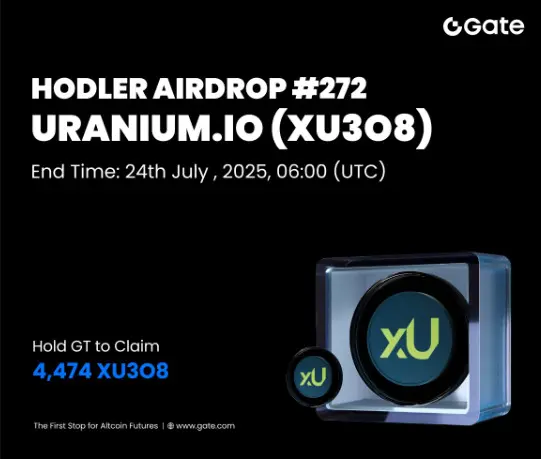
Uraniumio is changing the game by turning physical uranium into a real on chain asset you can actually own
Each XU3O8 token gives you direct exposure to one of the world’s most strategic resources fully audited fully compliant and built on Etherlink for fast low cost secure transactions
This isn’t just another token it’s a bridge between traditional commodities and DeFi making uranium liquid tradable and accessible to everyone from institutions to everyday investor
- Reward
- like
- Comment
- Repost
- Share
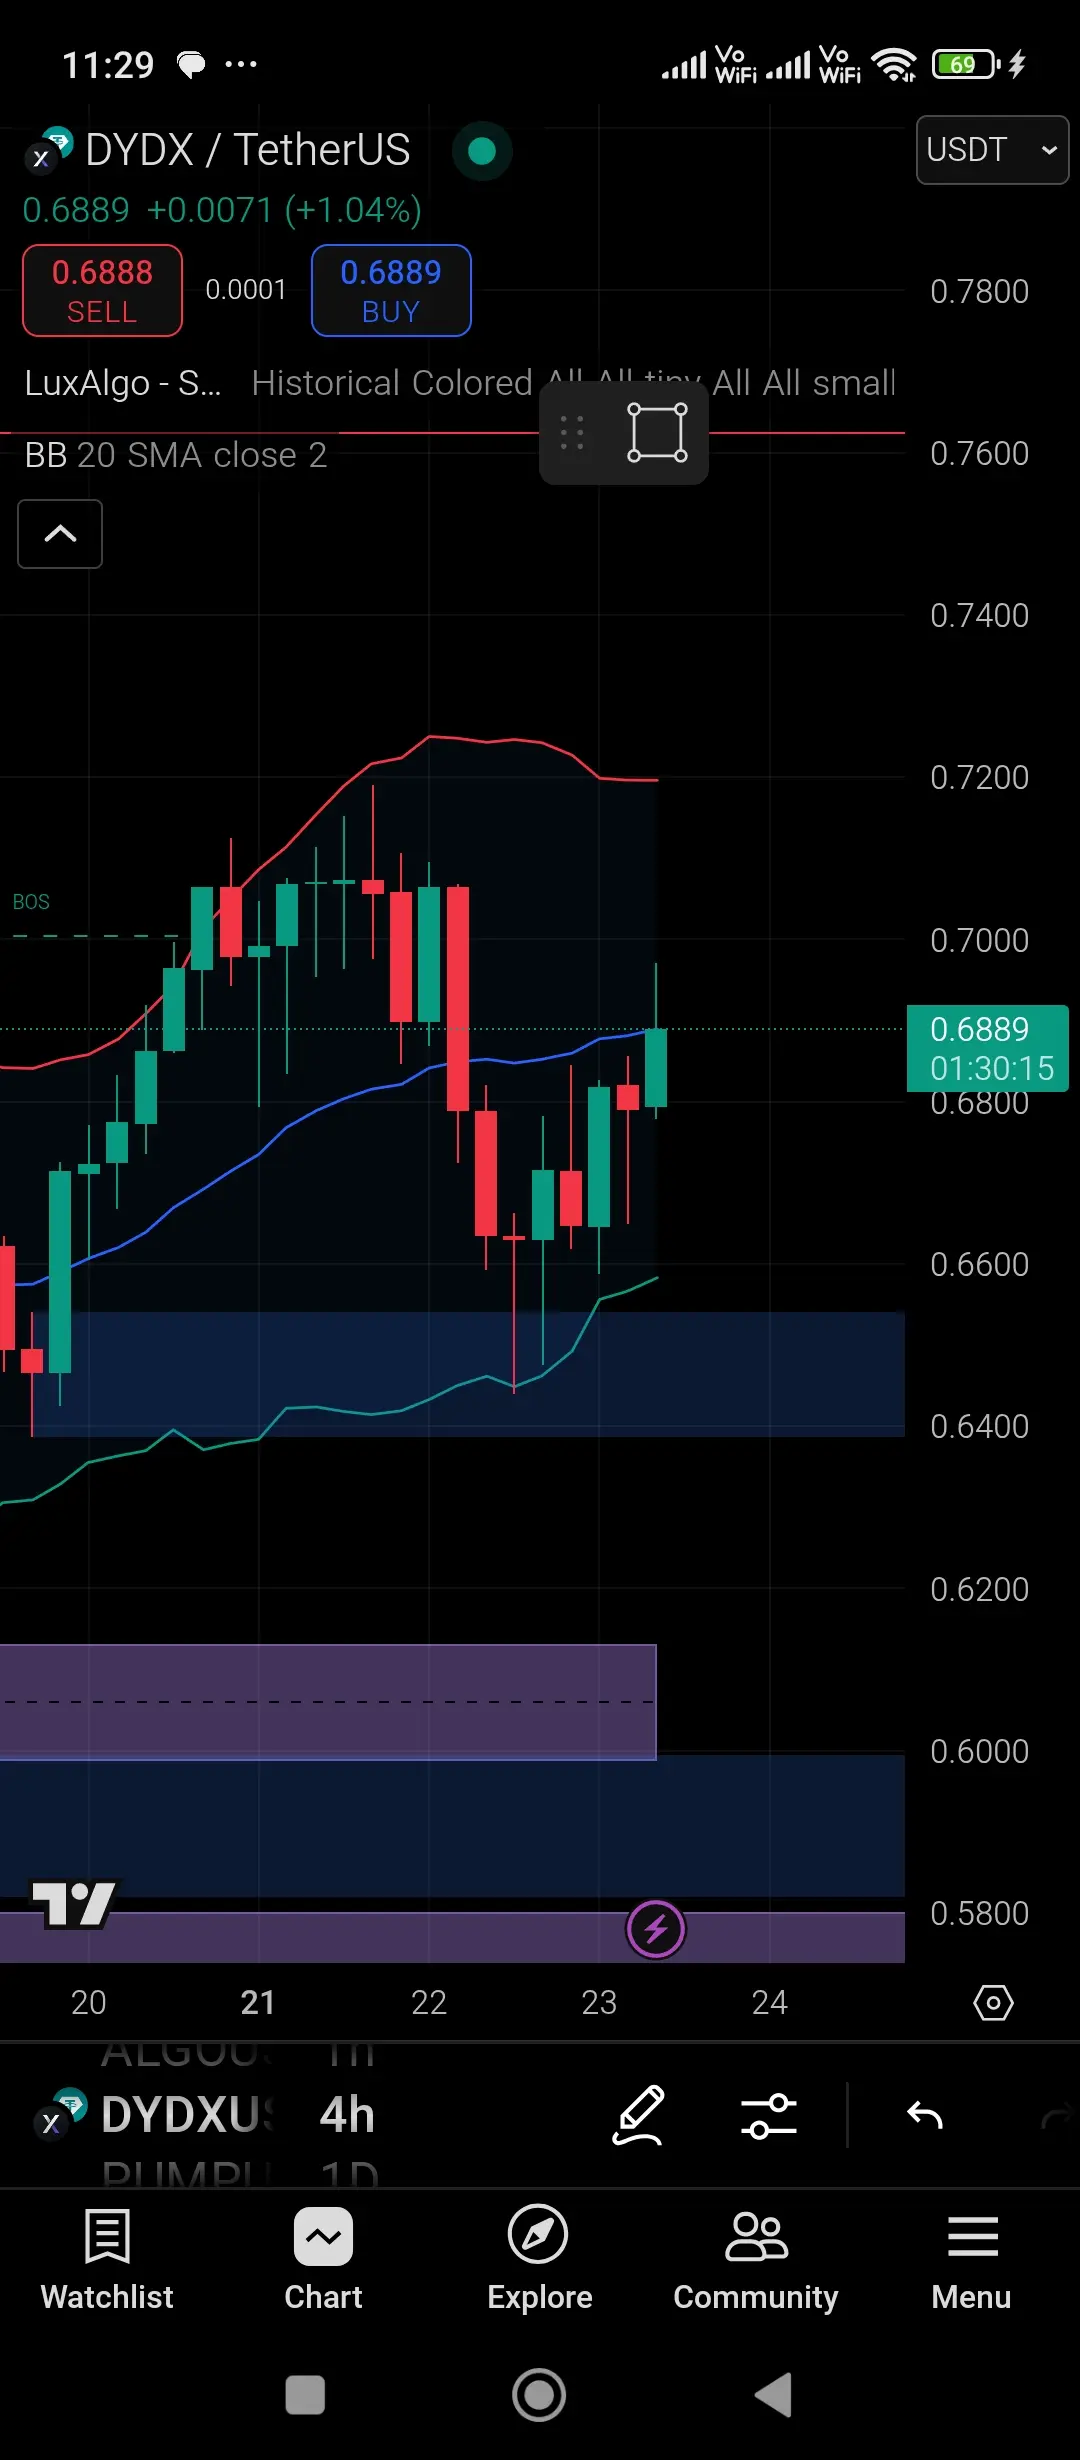
DYDX/USDT 4H chart.
Technical Observations
1. Current Price:
Around 0.6889 USDT, with a small bullish candle forming.
2. Bollinger Bands (BB 20 SMA):
Price has recently bounced off the lower band and is moving toward the midline (SMA 20).
Currently testing the midline resistance.
If price closes above the midline with volume, that may indicate strength.
3. Support Zone (Blue Box):
Around 0.6200–0.6500, clearly marked demand zone.
Previous wicks have bounced off this zone, showing strong buying interest.
4. Resistance Area:
Around 0.7000–0.7200 (from previous candle rejections)
📥 Entry Idea
- Reward
- like
- Comment
- Repost
- Share
- Reward
- like
- Comment
- Repost
- Share
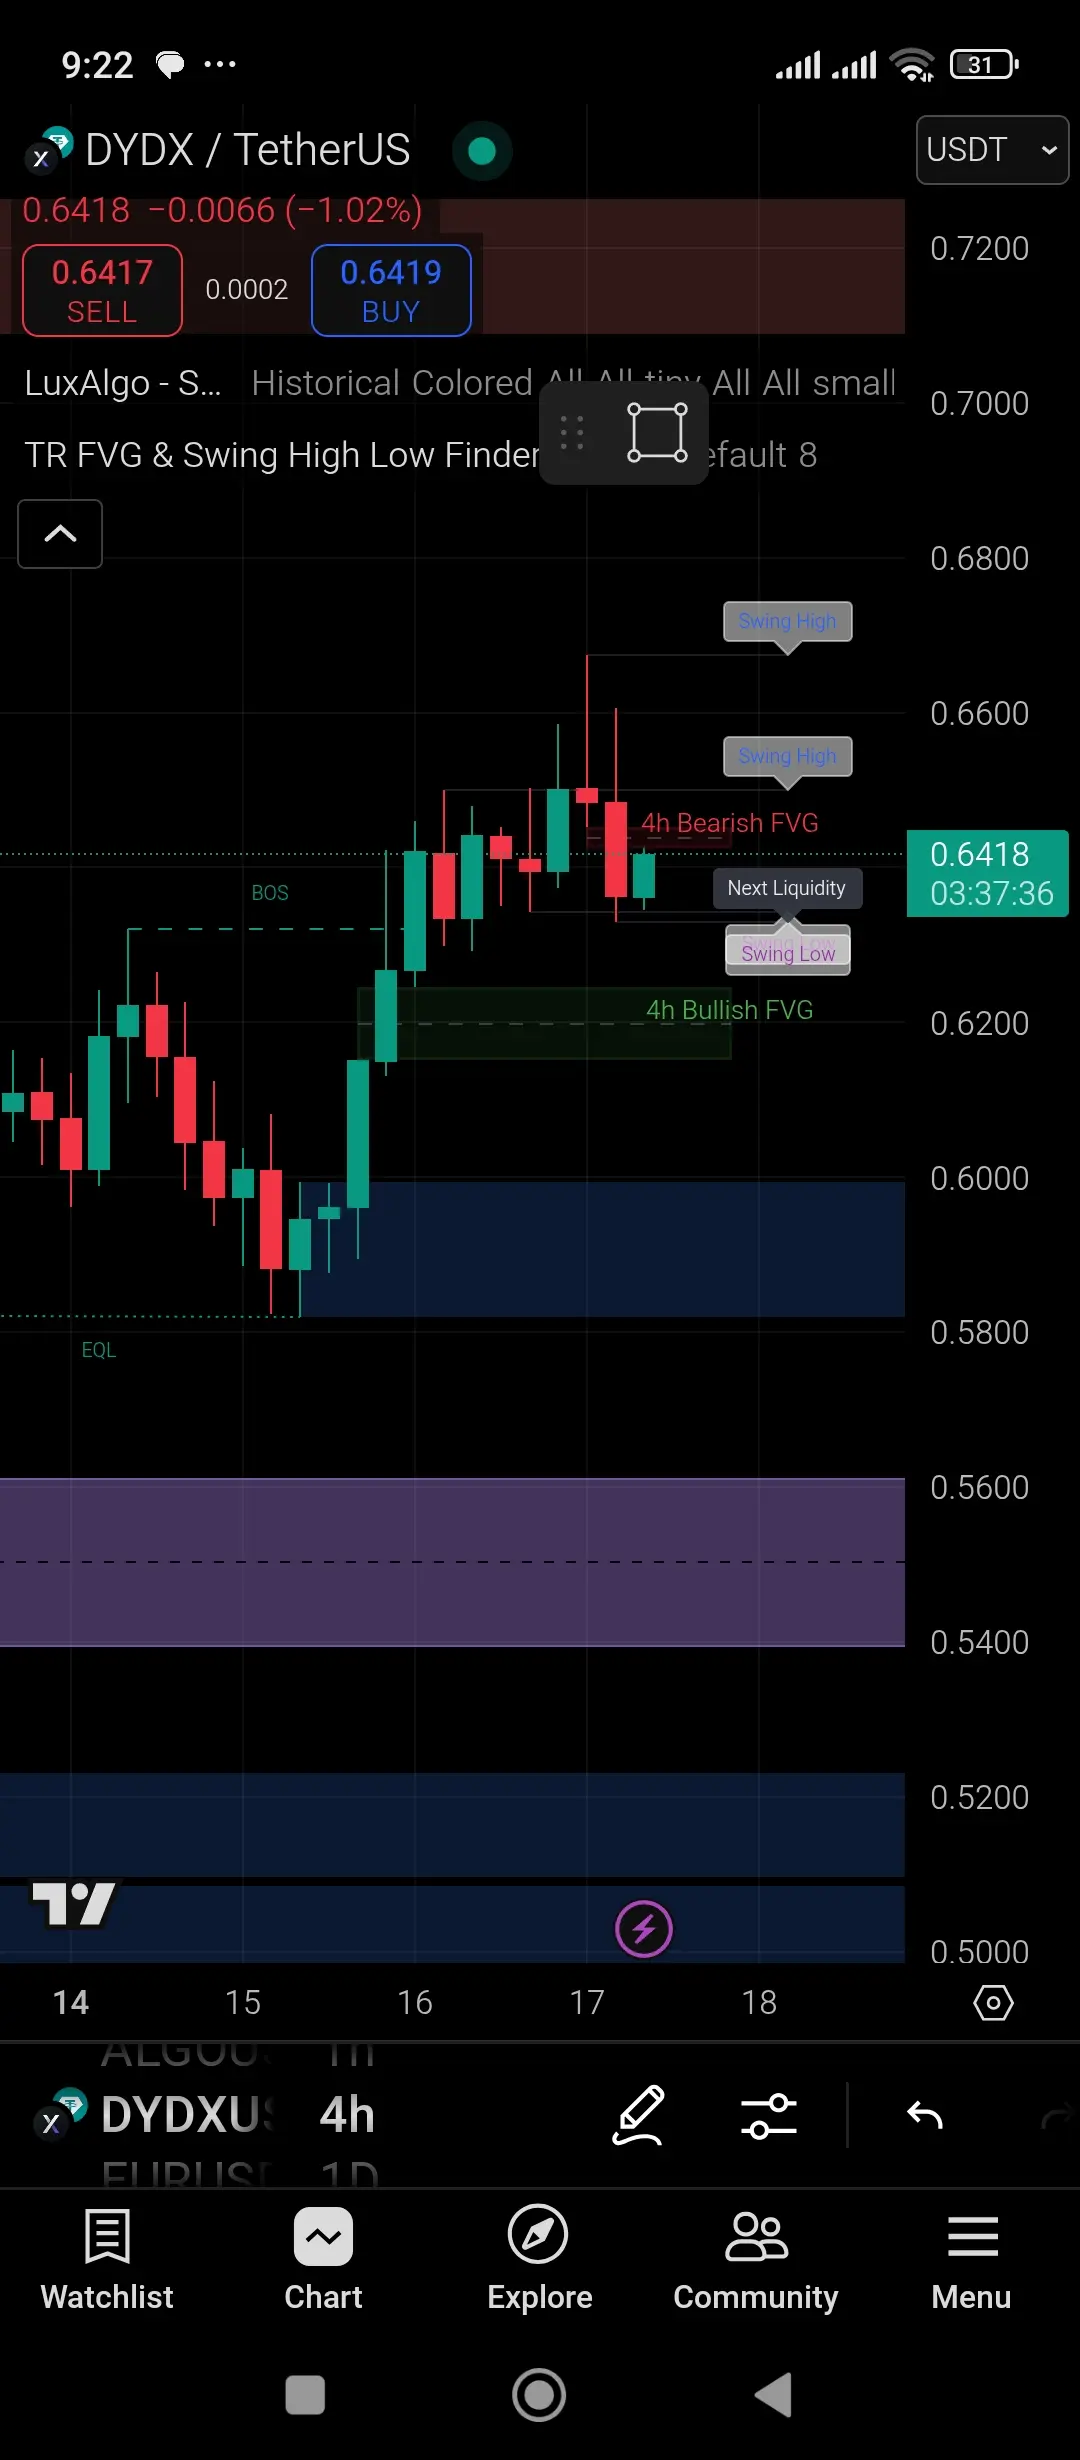
4H chart for DYDX/USDT breakdown and potential trading setup using the visible Fair Value Gaps (FVGs), structure, and liquidity zones:
Current Price: $0.6418
Recent High: $0.6650 (Swing High)
4H Bearish FVG: Around $0.656 - $0.664
4H Bullish FVG: Around $0.617 - $0.625
Market Structure:
Break of Structure (BOS) confirmed.
Swing Low Liquidity below current price could be targeted.
RSI (Not fully visible): Seems neutral, not overbought/oversold.
✅ Trade Idea (Short Setup)
Since price just tapped into the 4H Bearish FVG and rejected, a short (sell) setup may be forming.
Entry (Sell)
$0.655 - $0.
- Reward
- 3
- 1
- Repost
- Share
DragonFlyOfficial:
💫