Bull and Bear Flags: Mastering the Key Technical Patterns for Trend Continuation
The basic structure of bull flags and bear flags
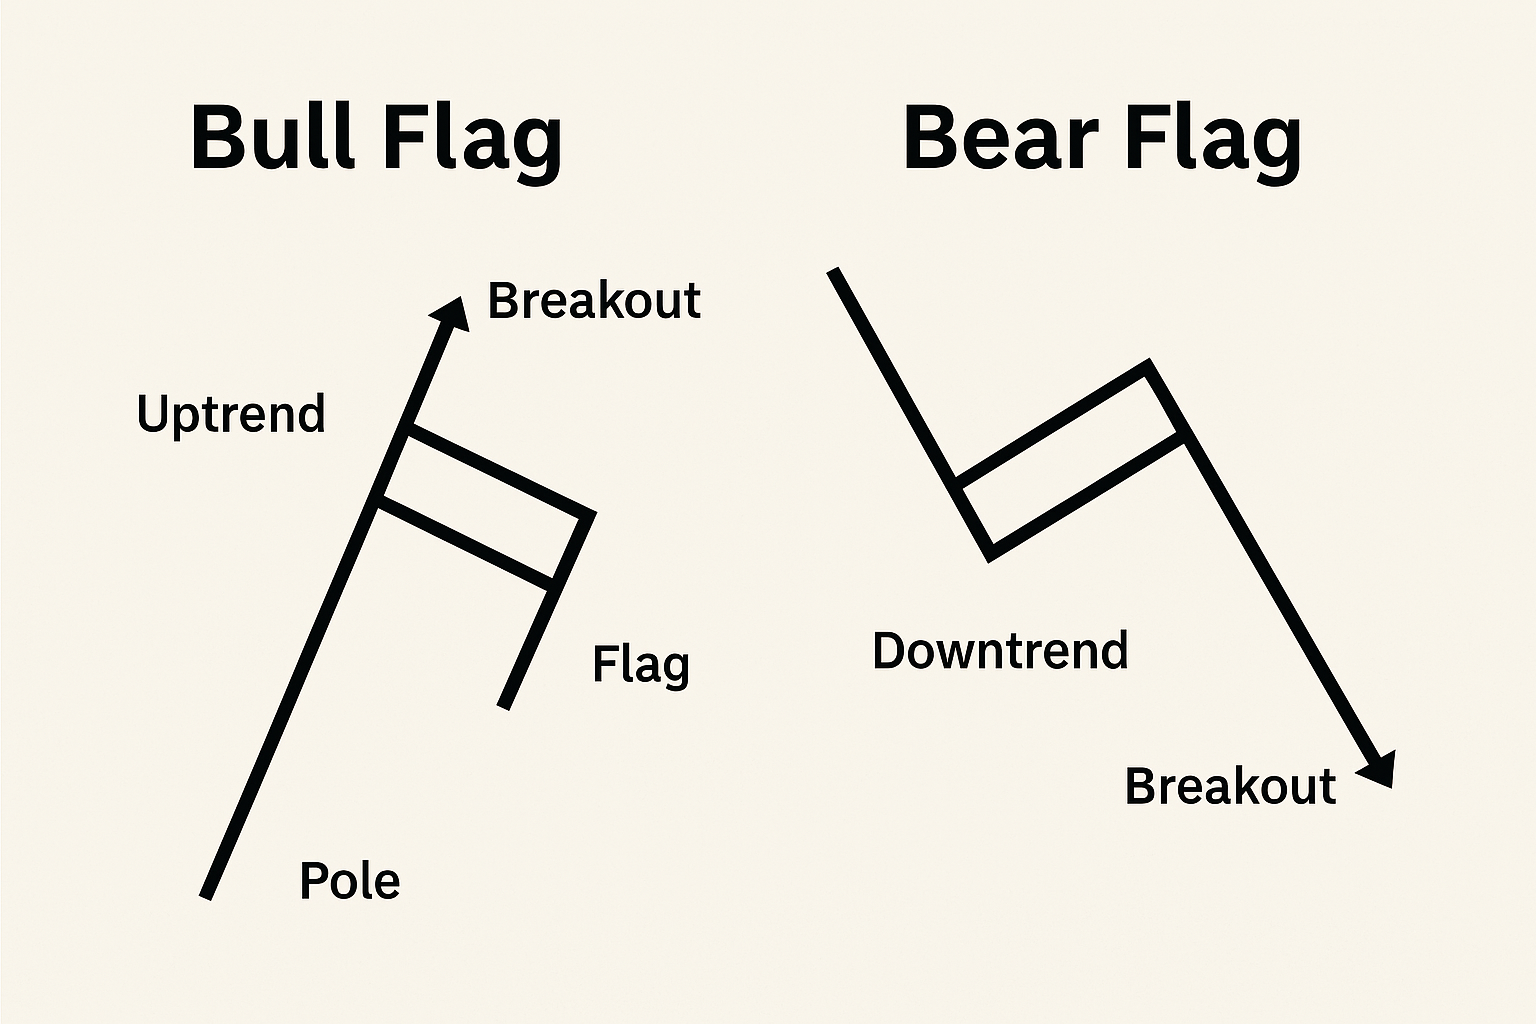
Bull flags usually appear in an uptrend, where the price first rises rapidly to form a flagpole, and then consolidates in a slightly downward sloping parallel channel, waiting for a breakout to continue moving upward. Bear flags are more commonly seen in downtrends, where the price falls sharply to form an upward sloping consolidation channel, breaking down to continue the downward trend.
Trading Strategies and Target Price Setting
The buying point for a bull flag is usually when the price breaks above the upper boundary of the flag, with the target price being the breakout point plus the height of the flagpole, and the stop loss set below the flag. A bear flag, on the other hand, is shorted when the price breaks below the lower boundary of the flag, with the target price being the breakout point minus the height of the flagpole, and the stop loss set above the flag.
How to avoid false breakouts
False breakouts are a common misjudgment among beginners. Effective methods include confirming the validity of breakouts by combining with trading volume, using the Relative Strength Index (RSI) to assess overbought or oversold conditions, and waiting for confirmation of the close after the breakout to improve the success rate of trades.
The difference between a bull flag and a triangle flag
Flags are mostly parallel rectangular channels, while triangle flags present converging triangles on both sides. Both are continuation patterns, but their structural forms and breakout directions differ. Accurate identification helps in formulating more suitable trading strategies.
Conclusion
Mastering bull flags and bear flags patterns is an important cornerstone of Technical Analysis, helping traders to grasp entry and exit opportunities in trends. Combining other technical indicators with strict risk control is essential for steady profits in a volatile market. Continuous practice and observation are key to becoming an expert.
Note: The content of this article is for reference only. Trading cryptocurrencies carries risks, please operate with caution.